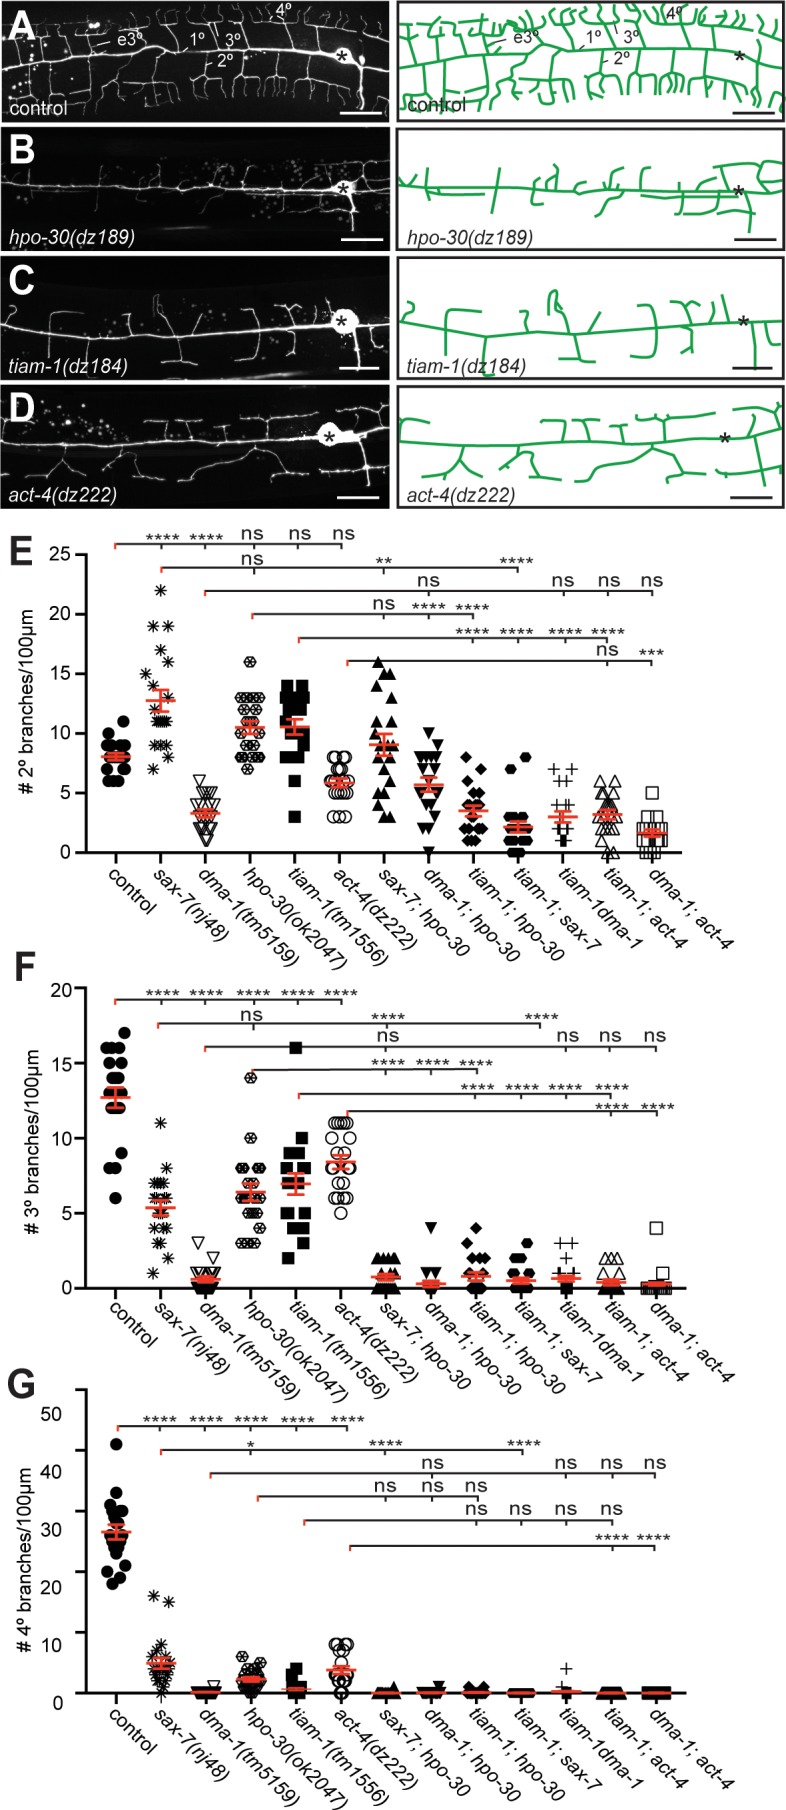
Figure 2. The hpo-30/Claudin, tiam-1/GEF, and act-4/Actin act genetically in the Menorin pathway.
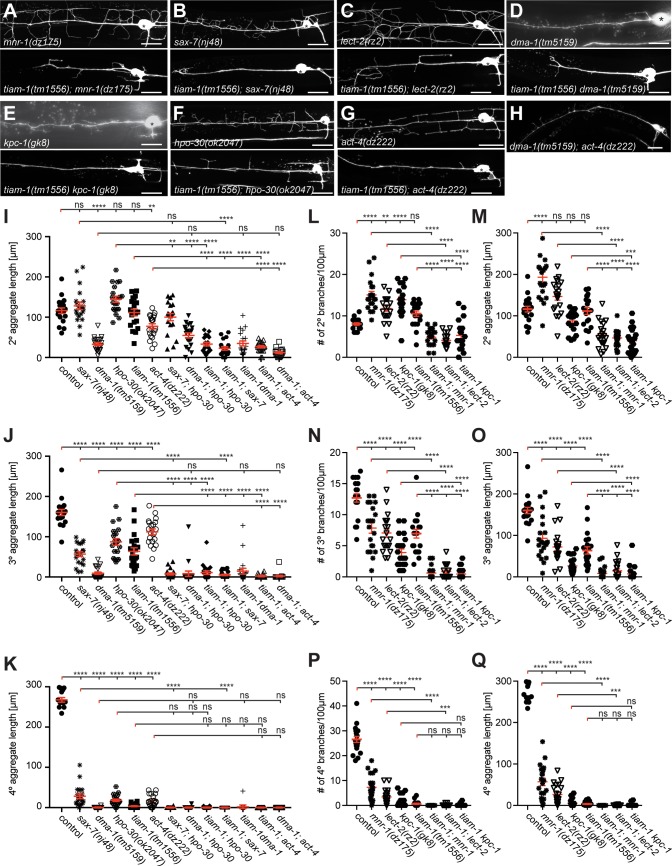
(A – D) Fluorescent images of PVD (left panels, visualized by the wdIs52 [F49H12.4p::GFP] transgene) and schematics (right panels) of the genotypes indicated. The control image is identical to Figure 1A and shown for comparison only. Details on alleles of individual genes and images of other alleles are shown in Figure 1—figure supplement 1. Scale bar indicates 20 µm. (E – G) Quantification of 2°, 3°, and 4° branch numbers per 100 µm anterior to the PVD cell body. Data for additional single and double mutants of the Menorin pathway as well as the average length and aggregate length of secondary, tertiary, and quaternary branches are shown in Figure 2—figure supplement 2. All alleles used are molecular or genetic null alleles (Material and methods for details). Data for control, lect-2, sax-7, mnr-1 and dma-1 mutant animals is identical to data from Díaz-Balzac et al. (2016) and shown for comparison only. For raw data see Figure 1—source data 1. Data are represented as mean ± SEM. Statistical comparisons were performed using one-sided ANOVA with the Tukey correction. Statistical significance is indicated (ns, not significant; *, p<0.05; **, p<0.01; ***, p<0.001; ****, p<0.0001). n = 20 animals for all genotypes.


