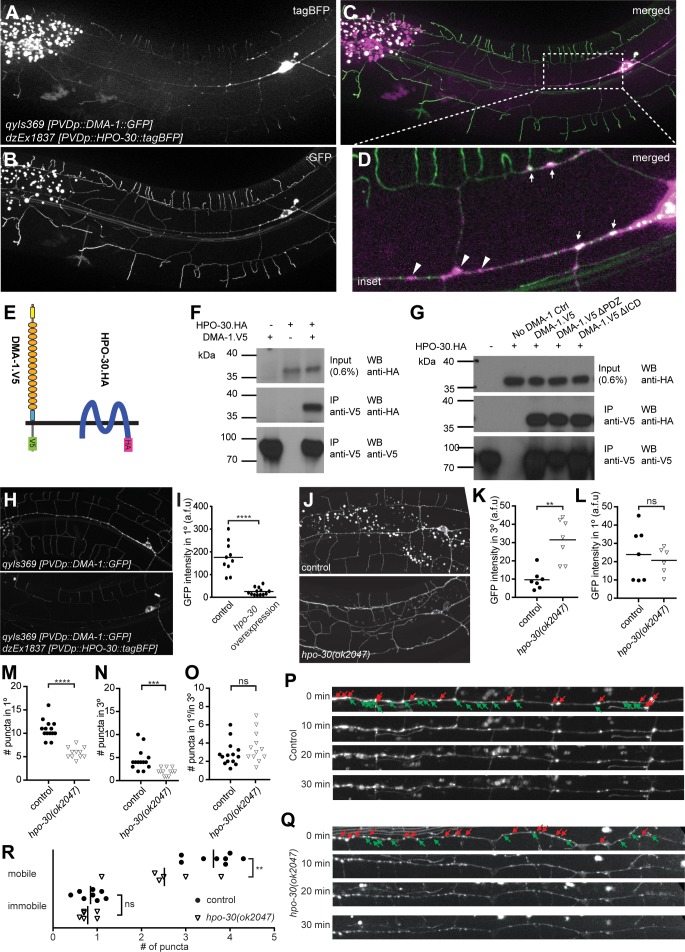
Figure 4. HPO-30/Claudin forms a complex with, and, localizes DMA-1/LRR-TM to higher order branches of PVD somatosensory neurons.
(A – D) Images of an animal with PVD-specific expression of HPO-30::tagBFP (A, dzEx1837) and DMA-1::GFP (B, qyIs369) as well as a composite image (C), respectively. Both reporters show diffuse staining across the dendrite in addition to discreet punctate staining, with inset enlargement (D) where white arrows indicate puncta of HPO-30::tagBFP and DMA-1::GFP colocalization and a scale bar 10 µm. (E) Schematic showing the topography of the DMA-1/LRR-TM single pass transmembrane receptor and the four transmembrane, claudin-like, HPO-30 protein. Immuno tags (V5 and HA) used for co-immunoprecipitation experiments are shown. Not to scale. (F – G) Western blots of co-immunoprecipitation experiments. Transfected constructs are indicated above the panels. Antibodies used for immunopreciptation (IP) and western blotting (WB) are indicated. A molecular marker is denoted on the left. Note, that all cases the two lower panels are from a single western blot, which was developed repeatedly with two different antibodies after stripping. In G., DMA-1.HA ΔPDZ and DMA-1.HA ΔICD are lacking the PDZ-binding site or the intracellular domain, respectively. Similar results were obtained from at least three independent replicate experiments. (H – I) PVD-specific expression of DMA-1::GFP (qyIs369) imaged in the presence (upper panel) or absence (lower panel) of a transgene with PVD-specific overexpression of HPO-30::tagBFP (dzEx1837) using identical imaging parameters for comparison of fluorescent intensity. The intensity of DMA-1::GFP appears substantially dimmer on the 1° dendrites when HPO-30::tagBFP is overexpressed. The average fluorescent intensity of the 1° dendrites within 50 µm of the cell body is quantified and presented in I). ****, p<0.0001, Mann-Whitney test. (J – O). PVD-specific expression of DMA-1::GFP (qyIs369) imaged in a hpo-30(ok2047) null mutant or wild type control animal using identical imaging parameters for comparison of fluorescent intensity. Fluorescent intensity was quantified for 3° and 1° dendrites within 50 µm of the cell body in K and L, respectively. The number of puncta for 3° and 1° dendrites between 30 and 130 µm from the cell body was counted and presented in M and N, respectively; the ratio of the puncta between 3° and 1° dendrites is presented in O. For raw data see Figure 1— source data 1. Statistical significance is indicated as ns, not significant; **, p<0.01; ***, p<0.001; ****, p<0.0001; Mann-Whitney test. (P) – R. Images of selected time points in a time-lapse series of visualizing DMA-1::GFP (qyIs369) in wild-type control and hpo-30 null mutant animals, imaged in 2 min intervals for 30 min to observe the dynamics of DMA-1::GFP puncta. Puncta between 30 to 130 µm anterior to the cell body were identified at t = 0 min and classified as mobile or immobile. Puncta were deemed immobile if there was no perceived movement throughout the whole time-lapse assay (30 min), and mobile otherwise. The number of mobile and immobile puncta were quantified in R. For raw data see Figure 1— source data 1. Statistical significance is indicated as **, p<0.01, 2-way ANOVA.

