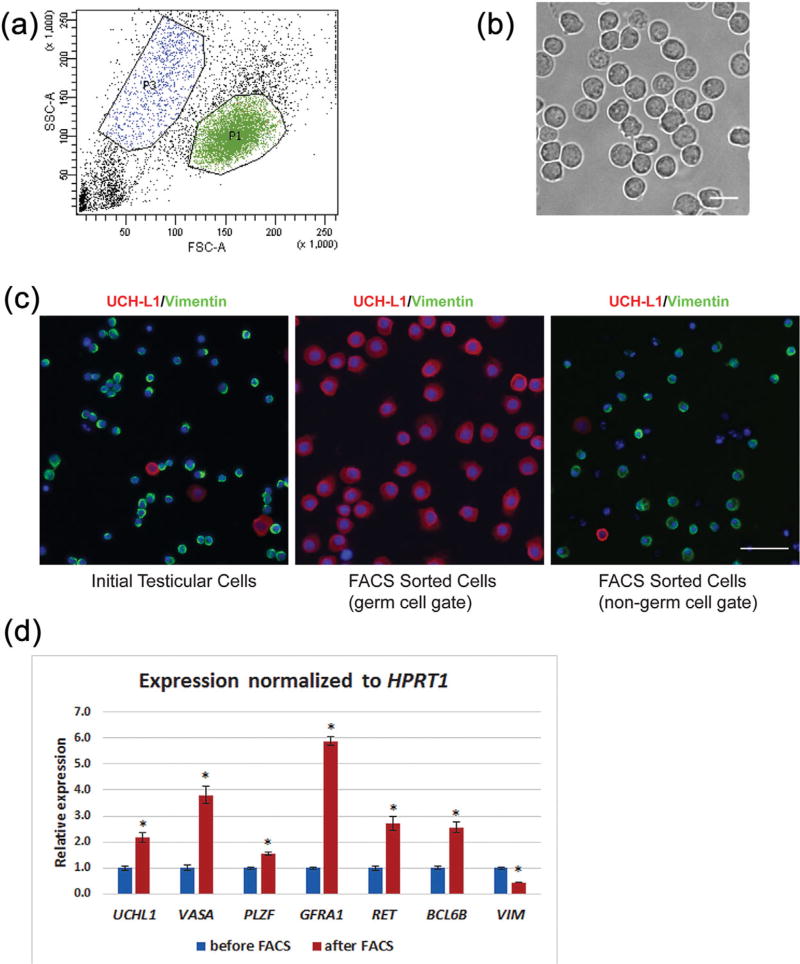
FIGURE 1.
Isolation of a cell population highly enriched for undifferentiated spermatogonia by sorting for light scatter properties. (a) Representative scatter plot. P1 indicates the germ cell gate, P3 the non-germ cell gate. (b) Phase contrast microscopic image of cells sorted from the germ cell gate (P1) illustrating the homogenous morphology of sorted cells. Bar = 20 µm. (c) Immunofluorescence analysis of cell populations before and after sorting. UCH-L1 labels undifferentiated spermatogonia, vimentin is expressed in testicular somatic cells. Cells sorted from the germ cell gate are highly enriched in undifferentiated spermatogonia while the majority of cells in the non-germ cell gate are somatic cells. Bar = 50 µm. (d) Relative expression levels of genes specifically expressed in spermatogonia or somatic cells. Sorted cells had significantly higher expression of genes previously reported to be specifically expressed in germ cells and significantly lower expression of vimentin

