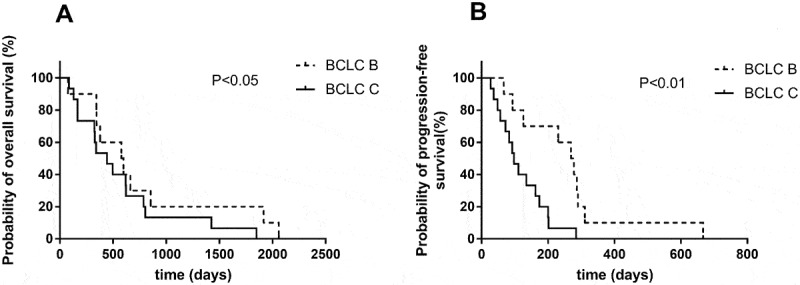
Figure 3.

Efficacy of the combination of TACE and apatinib.
(A) Kaplan–Meier survival curve showing the probability of overall survival (OS) stratifed by BCLC B and BCLC C. (B) Probability of progression-free survival (PFS) stratifed by BCLC B and BCLC C. The result showed patients with BCLC B has longer PFS and OS than BCLC C.
