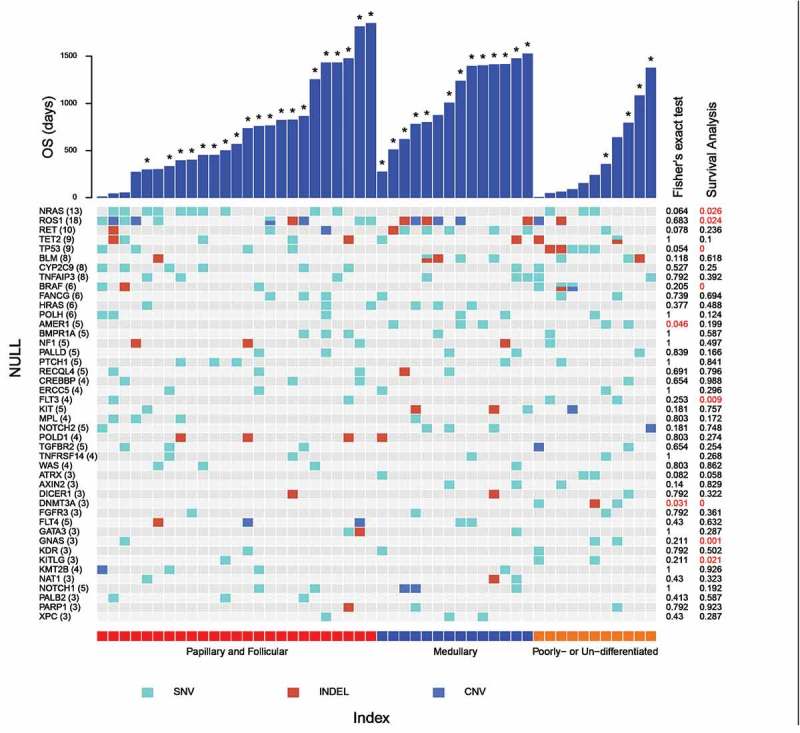
Figure 1.

Mutational profile of aggressive thyroid cancer patients. Each column represents an individual patient. Only genes whose mutations were detected in at least 3 patients were shown. The numbers in brackets following each gene name indicates the number of patients carrying the mutation. Overall survival of patients was plotted as bar graph, with asterisk marking the patients who still thrive at last revisit. The p-value of Freeman-Halton extension of Fisher’s exact test and survival analysis were listed on the right side with red color highlighting p-values < 0.05.
