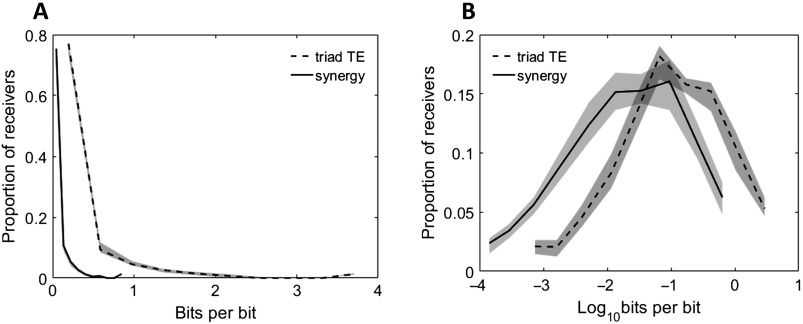
Figure 2. .
Distributions of neuron computation (synergy) and propagation (triad TE) are highly varied. Histograms of synergy and triad TE values for all receivers in all networks at all timescales. (A) Distributions of measured values. (B) Distributions of log-scaled values to emphasize variability. Solid and dashed lines depict the median across networks, and shaded regions depict 95% bootstrap confidence intervals around the median.

