
Fig. 3 .
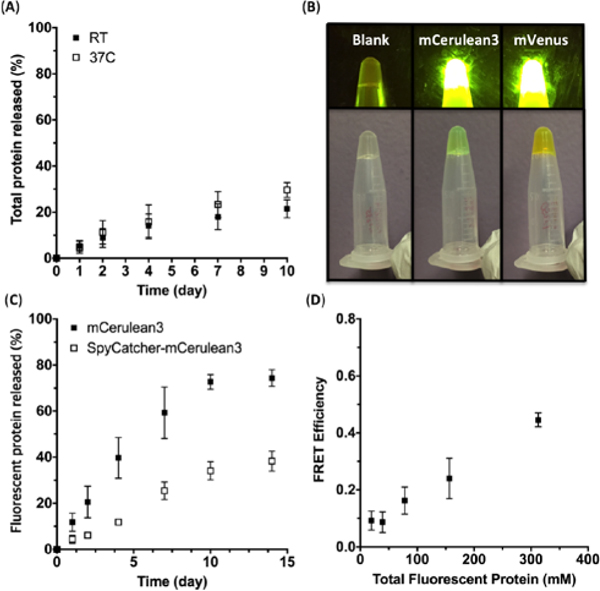
(A) Total protein erosion profile of the hybrid hydrogels at room temperature and 37°C. (B) Hydrogels containing no fluorescent protein (left), mCeruluean3 (middle), and mVenus (right). The top images were taken under blue light, and the bottom images were taken under normal conditions. (C) Leaching profile of fluorescent proteins from the hybrid hydrogels formed with unmodified and SpyCatcher-fused mCerulean3. (D) FRET efficiencies of the hydrogels containing equal amounts of mCerulean3 and mVenus. The x-axis refers to the total fluorescent protein concentration, which was limited to a range showing a linear concentration-fluorescence behavior. All of the above experiments were performed at least twice, and the error bars represent the standard deviation. In some cases the error bars were smaller than the size of the symbols.