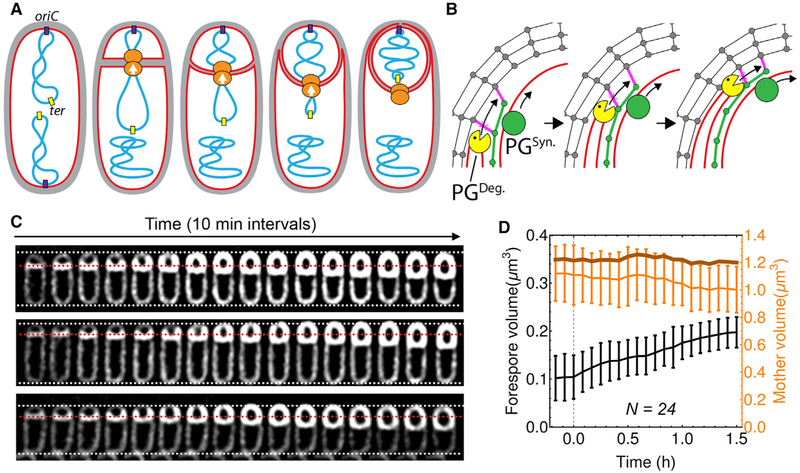
Figure 1. Forespore Growth during Sporulation.
(A) Diagram of polar septation, chromosome translocation, and engulfment showing membranes (red), PG (gray), chromosomes (blue), origin of replication (purple), terminus (yellow), and SpoIIIE (orange), with translocation polarity indicated by arrows.
(B) Model for engulfment membrane migration. New PG (green) is synthesized ahead of the engulfing membrane by forespore PG-biosynthetic machineries (PGSyn., green circle), crosslinked (magenta) to the lateral cell wall (gray), and degraded by SpoIIDMP (yellow Pacman), extending the septal PG and moving the septal junction around the forespore.
(C) Timelapse fluorescence microscopy of three wild-type sporangia throughout engulfment showing FM4–64 stained membranes (white). Dotted lines are added as references, with white indicating the total length of the sporangium and red the original position of the septum.
(D) Average forespore volume (black line, left y axis), mother cell volume (light orange line, right y axis) and forespore plus mother cell volume (dark orange line, right y axis) of wild-type sporangia over time. Time traces were aligned so that 0 hr was the onset of septum curving. Error bars represent standard deviation.
See also Figure S1 and S2.

