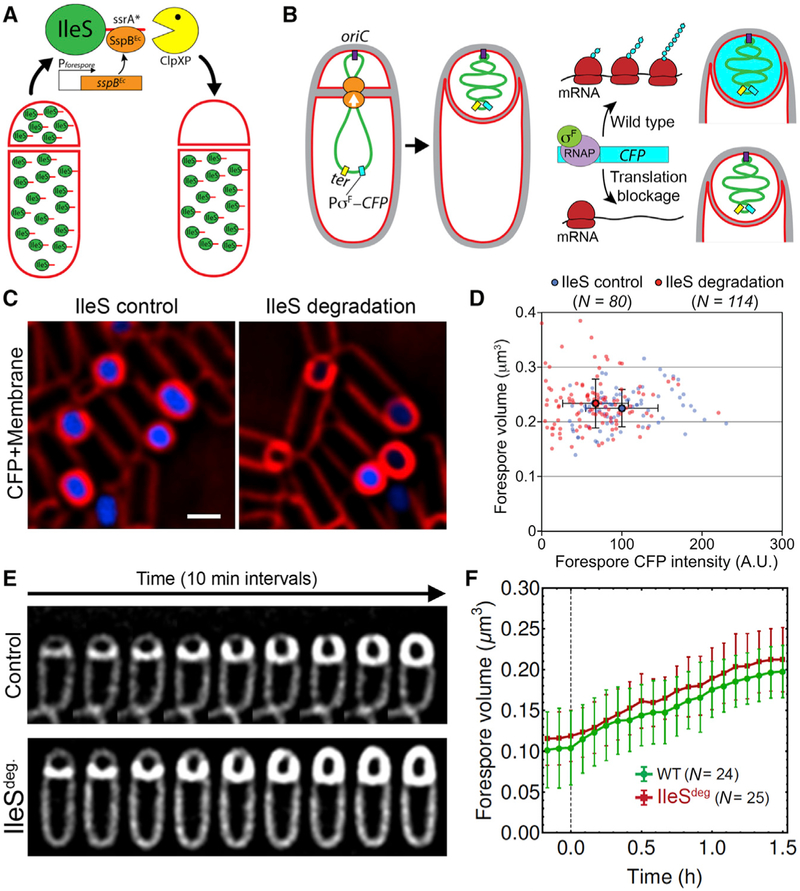
Figure 4. Sustained Protein Synthesis in the Forespore Is Not Required for Growth.
(A and B) Strategies to block translation in the forespore (A) and to determine the degree to which IleS-ssrA* degradation reduces forespore translation (B).
(C) Fluorescence microscopy of sporangia expressing PspoIIQ–CFP without IleS degradation (left) or with IleS degradation in the forespore (right). Membranes were stained with FM4–64 (red). CFP images (blue) used identical exposures and adjustments to directly compare fluorescence intensity. Scale bar, 1 μm.
(D) Total CFP fluorescence in the forespore (x axis) versus forespore volume (y axis) of sporangia without (blue) or with (red) IleS degradation in the forespore. Each dot represents an individual forespore. Solid dots represent the average CFP intensity and volume of wild-type (blue) and IleS-depleted forespores (red). Error bars represent standard deviations. IleS degradation significantly reduced CFP intensity (p < 0.0001) but has no effect on forespore size (p = 4625) compared to the control.
(E) Timelapse fluorescence microscopy of wild-type (control) and after IleS degradation in the forespore (IleSdeg.).
(F) Change in forespore volume during engulfment in wild-type (WT, green) and after forespore degradation of IleS (IleSdeg., red). Error bars represent standard deviation.
See also Figure S4.

