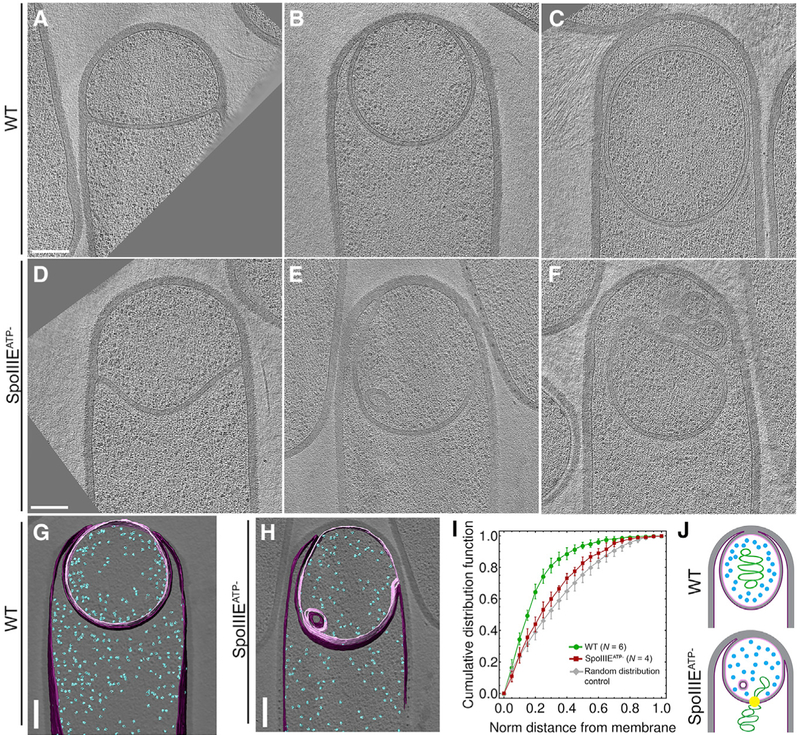
Figure 6. DNA Translocation Affects Ribo-some Distribution and Membrane Topography.
(A–F) Slices of cryo-electron tomograms depicting different stages of engulfment in wild-type sporangia (A–C) and corresponding states in spoIIIEATP− sporangia (D–F). Scale bar, 200 nm.
(G and H) Segmented tomogram of WT (G) and spoIIIEATP− (H) sporangia, showing ribosomes (blue), the forespore membrane (pink), and the mother cell membrane (purple).
(I) Cumulative distribution of ribosomes as a function of the distance from the forespore membrane in WT (green) and SpoIIIEATP− forespores. The gray line represents the cumulative distribution of randomly distributed sets of ribosomes generated in silico. Error bars represent standard deviation.
(J) Cartoons illustrating the exclusion of ribosomes by the forespore nucleoid.
See also Figure S5.

