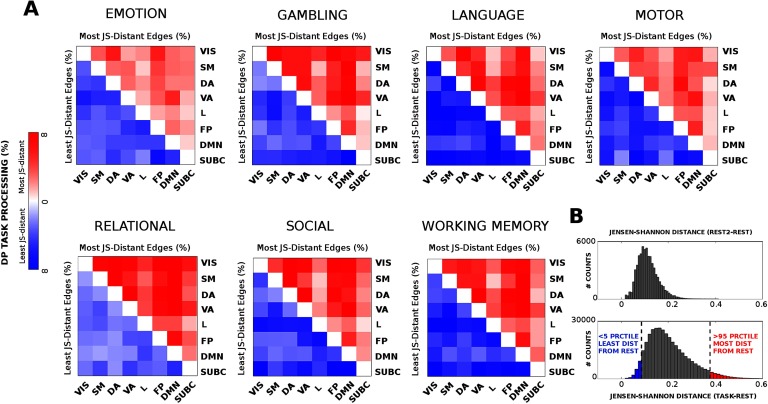
Figure 4. .
Least and most distant edges per functional network across tasks. (A) Heat maps, for all seven fMRI tasks evaluated, showing the most (red, upper triangular) and least (blue, lower triangular) distributed processing (DP) values between pairs of functional networks with respect to REST. (B) Top: distribution of JS-distance values when comparing REST2 session to the baseline REST session. Bottom: distribution of Jensen-Shannon distance values across the seven tasks evaluated. The tails of the histogram are highlighted in blue (least distant edges, < 5th percentile) and red (most distant edges, > 95th percentile).

