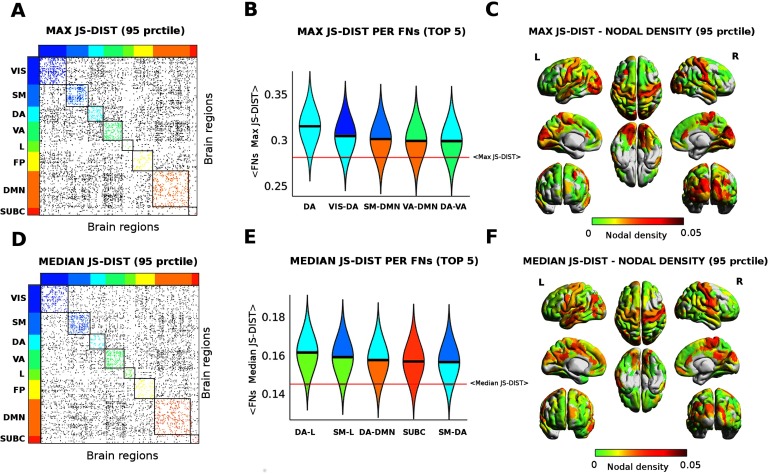
Figure 5. .
Functional reconfiguration via Jensen-Shannon distance. (A–D) Edgewise max (A) and median (D) Jensen-Shannon distance across all tasks (thresholded by 95th percentiles for max and for median). The colored dots depict JS values within FNs; gray dots indicate significant JS-distant edges between FNs. (B–E) Violin plot of edgewise JS distance (max and median) for the top five FNs and FN interactions. Within-FNs are color coded accordingly (as in A–D), while between-FNs are color coded using the colors of the two FNs involved. Solid black lines depict median values of each distribution; solid red lines indicate the whole-brain median value of max and median distributions. (C–F) Brain render of max and median JS distances as nodal density per region. The strength per brain region computed as sum of JS distance (max and median) for functional edges above the 95 percentile threshold divided by the total number of brain regions.

