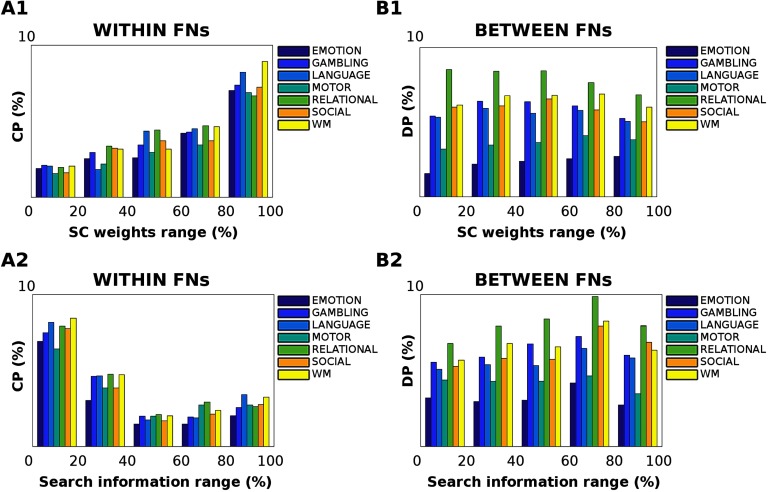
Figure 6. .
Effect of structural pathways on centralized and distributed processing changes. (A1–B1) The relationship between the anatomical connections and Jensen-Shannon distance was evaluated across the seven different tasks. The bar plots show the percentage of centralized processing (CP) within functional networks (FNs, A1) and distributed processing (DP) between FNs (B1), per five different percentile ranges of structural connectivity weights: 0–20, 20–40, 40–60, 60–80, and 80–100. The percentile range was extracted from the group-averaged structural connectome. Note how, for within-FN connections (A1), the change in centralized processing significantly correlates with the strength of structural connections across all tasks (one-way ANOVA F = 163.39, df = 4, p = 6.62 ⋅ 10−20); conversely, the underlying structural connectivity does not play a major role in distributed processing changes (one-way ANOVA F = 1.11, df = 4, p = 0.37). (A2–B2) The effect of structural path accessibility (as measured by search information; see Methods) on centralized and distributed processing was tested across the seven different tasks, per five different percentile intervals of search information: 0–20, 20–40, 40–60, 60–80, and 80–100. The percentile range was extracted from the group-averaged search information matrix. Notably, changes in centralized processing (A2) are significantly associated with low values of search information (one-way ANOVA F = 131.75, df = 4, p = 1.41 ⋅ 10−18); conversely, no significant association between SI and distributed processing changes was found (one-way ANOVA F = 1.85, df = 4, p = 0.14).

