Figure 1. .
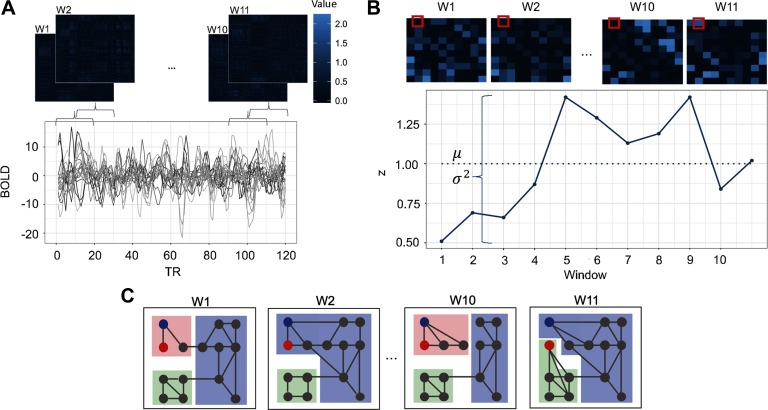
An overview of the construction of time-dependent, whole-brain connectivity matrices and computation of dynamic rs-fMRI indices. Panels (a) through (c) provide an overview of the construction of time-dependent, whole-brain connectivity matrices and computation of dynamic rs-fMRI indices. In panel (a), time courses of blood oxygen level-dependent (BOLD) signals from 270 brain regions were extracted. A sampling of these time courses is plotted (bottom). For each time window (w1, w2, …, w11), node-by-node connectivity matrices were estimated using Pearson correlations, the resulting r values of which were Fisher-z transformed (top). In panel (b), computation of the dispersion index is illustrated. The z value of the edge connecting two nodes at each time window (outlined in red; top) is plotted (continuous blue line; bottom). Dispersion was calculated by dividing the variance () of the 11 z values by the mean () of the 11 z values (mean is indicated by a dotted blue line). Panel (c) illustrates time-dependent community structure over each time window as computed using a multilayer modularity maximization algorithm. Nodes are assigned communities at each time window. A flexible node (blue node) changes community many times (pink, purple, pink, purple). A promiscuous node (red node) also changes communities many times but is marked by allegiances to many communities (pink, purple, pink, green).

