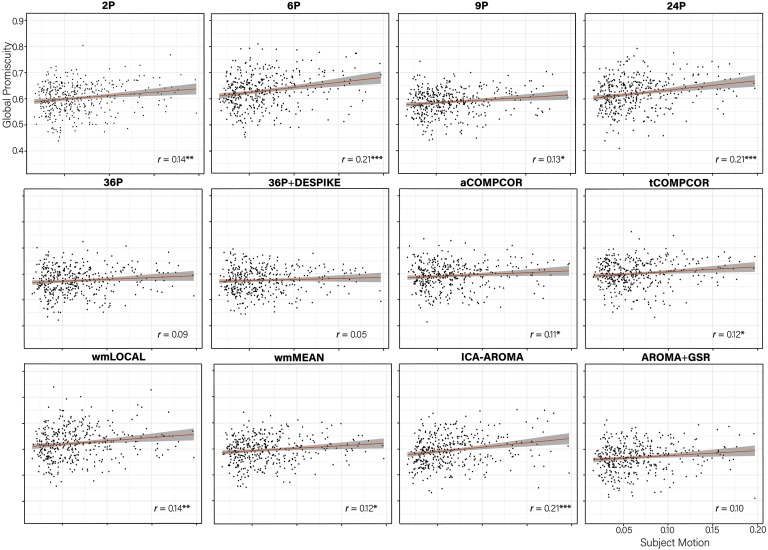
Figure 14. .
Scatterplot of the association between subject motion (x-axis) and global promiscuity (x-axis) with trend line. The partial correlation between subject motion and global promiscuity controlling for age and sex is presented in the bottom right of each panel. ***p < 0.001; **p < 0.01; *p < 0.05.

