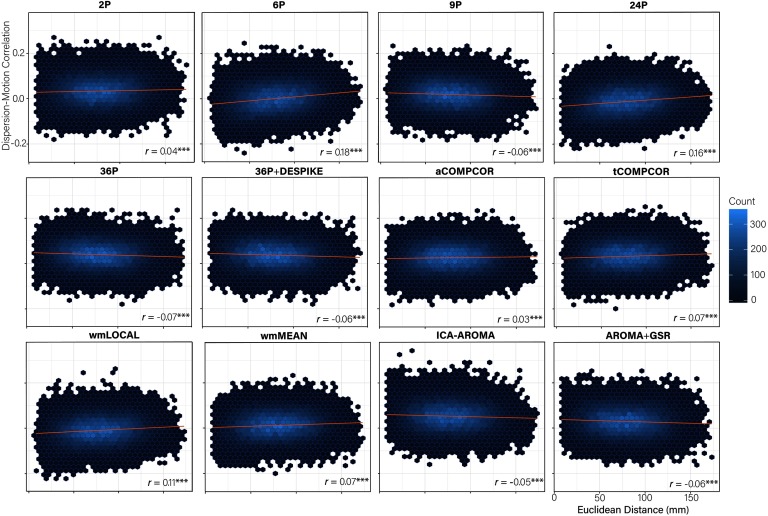
Figure 5. .
Hexbin plots of the association between the Euclidean distance separating nodes (mm) and the magnitude of the dispersion-motion correlation between the edge connecting the nodes (y-axis). A trend line for each pipeline is indicated in blue and the magnitude of the correlation is presented in the bottom right of each panel. Note: ***p < 0.001.

