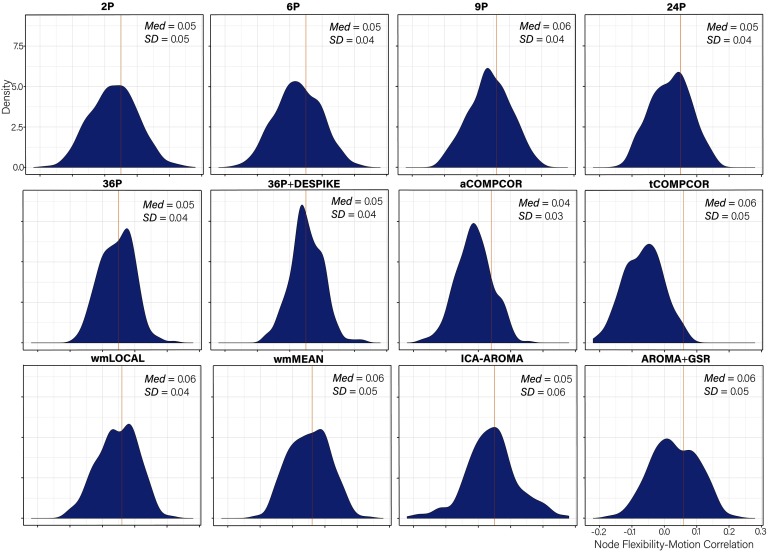
Figure 7. .
Distributions of all node flexibility-motion correlations after de-noising for each pipeline. The median absolute value of the correlation and the standard deviation of the correlation is displayed in the top right of each panel. Panels are ordered by the magnitude of the absolute correlation.

