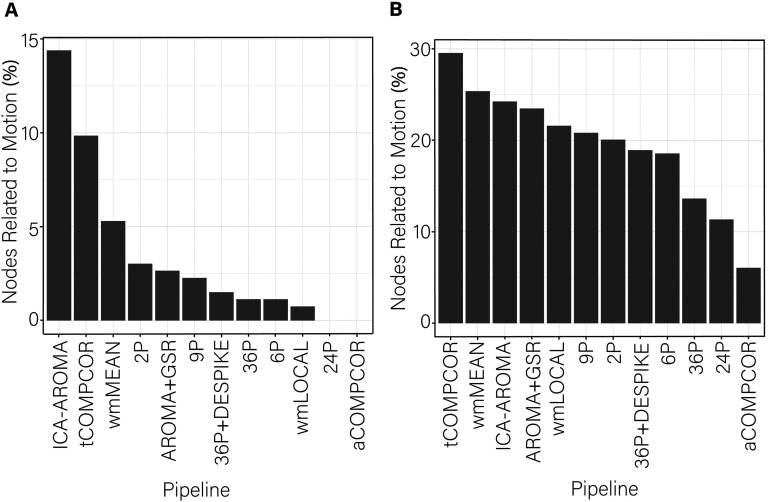
Figure 8. .
Percentage of nodes significantly related to motion after de-noising for node flexibility. More effective de-noising pipelines reduced the relationship between flexibility and motion. Bars are ordered such that the least effective de-noising pipelines are on the left and the most effective are on the right. Panel A illustrates the results after correcting for multiple comparisons. Panel B depicts the results without controlling for multiple comparisons.

