
Figure 2:
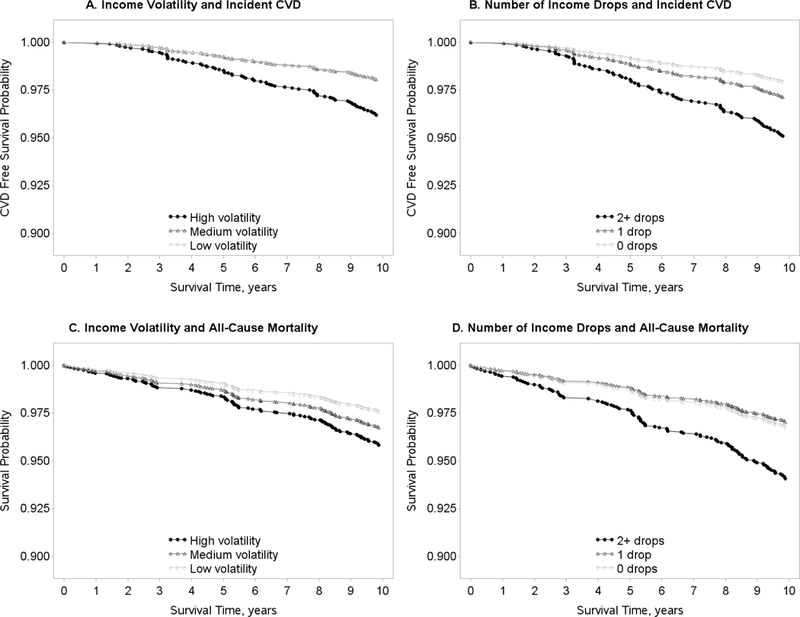
Adjusted survival curves for income volatility and number of income drops (1990 – 2005) with cardiovascular disease free survival and overall survival (2005 – 2015). All models are adjusted for 1990: age, sex, race, less than a high school education, marital status, number of people in the household, study site, BMI, systolic blood pressure, total cholesterol, HDL cholesterol, smoking, alcohol use, physical activity, elevated depressive symptoms, income, unemployment status, and 1992 fasting glucose and health insurance status. Panel A depicts the adjusted survival curve for the association between income volatility with CVD; Panel B depicts the adjusted survival curve for the association between the number of income drops with CVD; Panel C depicts the adjusted survival curve for the association between income volatility with all-cause mortality; Panel D depicts the adjusted survival curve for the association between the number of income drops with all-cause mortality.