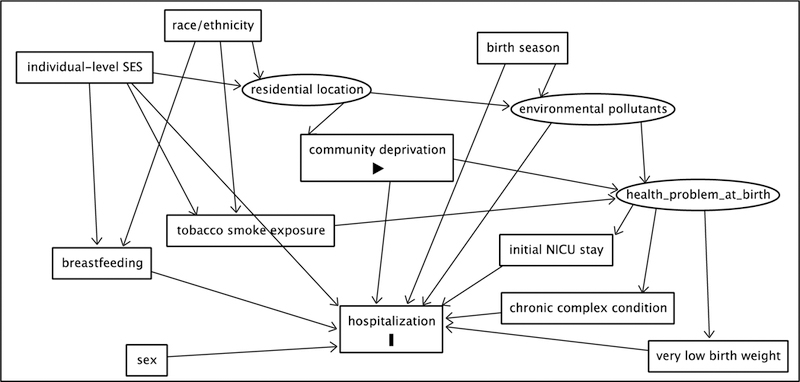
Figure 3.

A directed acyclic graph developed as a part of our causal inference framework used for covariate selection in our statistical models. Here, the box labeled “community deprivation” is the exposure and the box labeled “hospitalization” is the outcome. Latent, unobservable, or unmeasured covariates are represented by ovals and other covariates are represented by rectangles.
