Figure 1.

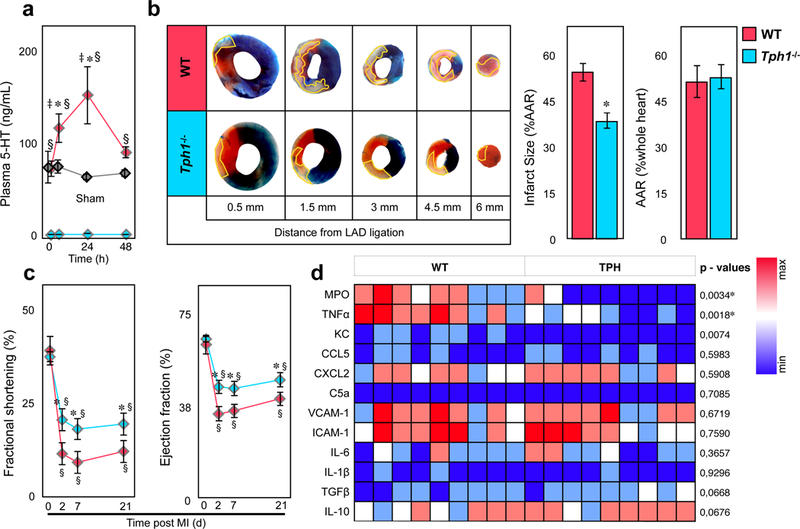
Myocardial reperfusion injury is dampened in Tph1−/− mice. (a) Plasma serotonin levels in WT (red) and Tph1−/− (blue) before, 6, 24, and 48 hours after myocardial infarction with reperfusion. Values in sham (thoracotomy was performed without ligation of the LAD) operated WT mice are shown in grey. Results are presented as mean ± SEM, ✽p<0.05 denote significant changes compared to time point 0 hours within groups, § p<0.05 denote significant changes between WT and Tph1−/− mice, and ‡ p<0.05 between WT and Sham, two-way ANOVA with Bonferroni’s multiple comparisons testing, n≥6 independent animals per group and time point. (b) Representative images of heart sections of WT and Tph1−/− mice after 30 minutes of LAD ligation with 24 hours of reperfusion at increasing distance from the site of ligation. The infarct area (white tissue) is circumscribed in yellow and quantified as percentage of area at risk (AAR; non-blue tissue). The AAR is presented as percentage of the entire heart section. Viable tissue within the AAR was stained in red. Results are presented as mean ± SEM, ✽p<0.05, Student´s t-test, n≥10 per group, WT (red) and Tph1−/− (blue). (c) Time course of fractional shortening (FS) and left ventricular ejection fraction of WT and Tph1−/− mice recorded under baseline (d0) conditions and repetitively over 3 weeks (at day 2, 7, and 21) following myocardial infarction with reperfusion. Results are presented as mean ± SEM, ✽,§p<0.05, ✽ denotes significant changes between different genotypes; § denotes significance compared to d0 within groups; Two-way repeated measures ANOVA with Bonferroni’s multiple comparison testing, n=8 per group, WT (red) and Tph1−/− (blue). (d) Expression of pro- and anti-inflammatory target genes in homogenized heart tissue after I/R injury. Results are presented in a heat map depicting 2−▵Ct values, n=9 per group, each column represents one WT or Tph1−/− mouse. P values were derived from comparison of respective 2−▵▵Ct values by unpaired t-tests, and asterisks denote significant differences according to correction for multiple comparisons using the Holm-Sidak method.
