
Figure 2.
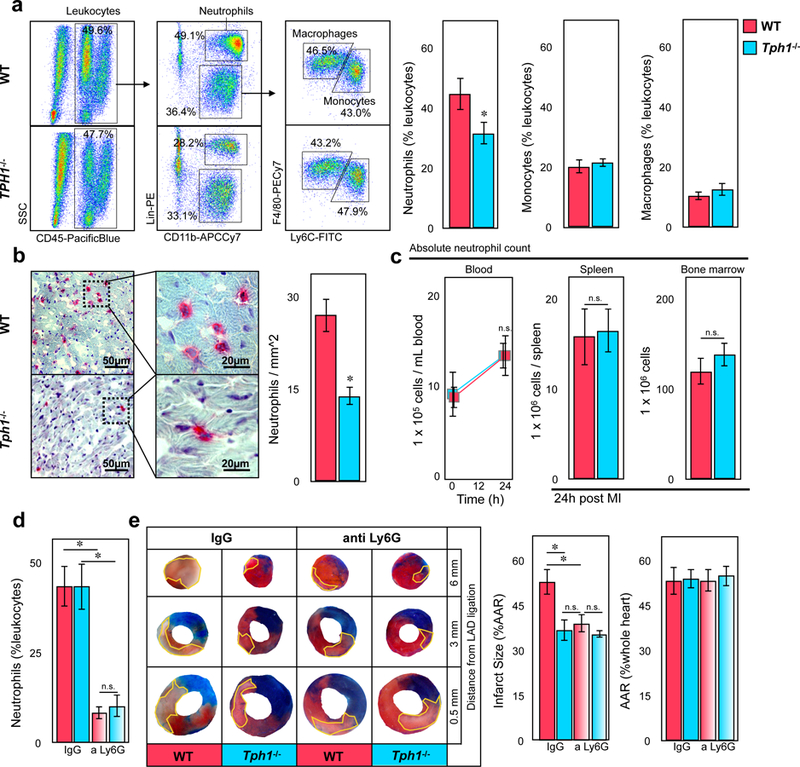
Reduced neutrophil accumulation in hearts of Tph1−/− mice following myocardial I/R injury. (a) Representative flow cytometric dot plots of digested cardiac tissues of WT and Tph1−/− mice 24 hours after myocardial ischemia and subsequent reperfusion (left panels). Quantification of neutrophils, monocytes, and macrophages in cardiac tissue of WT (red) and Tph1−/− (blue) mice 24 hours after myocardial I/R injury (right panels). Results are presented as mean percent of CD45.2+ leukocytes ± SEM, ✽p<0.05, Student´s t-test, n≥7 per group. (b) Representative immunohistology of myocardial infarct tissue. Ly6G+ neutrophils are stained in red (left panels) and quantified per mm2 tissue section of WT (red) and Tph1−/− (blue) mice. Results are presented as mean ± SEM, ✽p<0.05, Student´s t-test, n≥9 per group. (c) Neutrophil counts of WT (red) and Tph1−/− (blue) mice in blood before, and in blood, spleen and bone marrow after myocardial I/R injury. Results are presented as mean ± SEM, n.s., two-way ANOVA with Bonferroni’s multiple comparison testing was used for blood samples, Student´s t-test was used for spleen and bone marrow, n=6 independent animals per group and time point. (d) Quantification of blood neutrophils following depletion with anti-Ly6G versus IgG control. Results are presented as mean ± SEM, ✽p<0.05, two-way ANOVA with Bonferroni’s multiple comparison testing, n=6 per group, WT (red) and Tph1−/− (blue). (e) Representative images of heart sections of WT and Tph1−/− mice after 30 minutes of LAD ligation followed by 24 hours of reperfusion at increasing distance from the site of ligation. The infarct area (white tissue) is circumscribed in yellow and quantified as percentage of area at risk (AAR; non-blue tissue). The AAR is presented as percentage of the entire heart section. Viable tissue within the AAR was stained in red. Results are presented as mean ± SEM, ✽p<0.05, two-way ANOVA with Bonferroni’s multiple comparison testing, n=6 per group, WT (red) and Tph1−/− (blue)