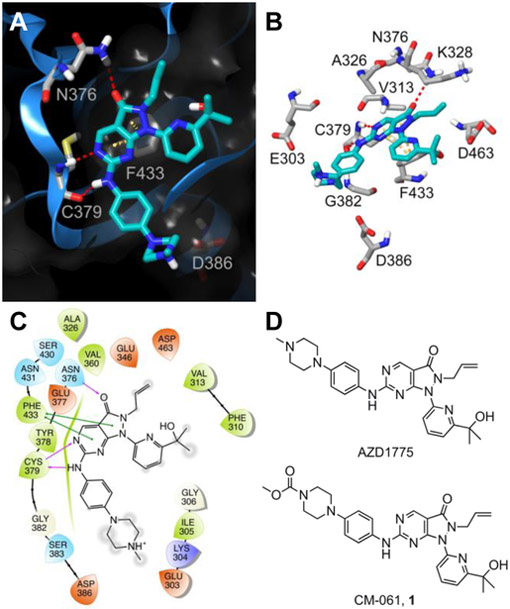
Figure 2. Structure of WEE1 inhibitors AZD1775 and CM-061 (1) and predicted WEE1-AZD1775 interactions.
(A) Ribbon representation (blue ribbon, grey amino acid residues; with clipped pane molecular surface colored dark grey) of the ATP-binding site of WEE1 displaying the predicted binding mode of AZD1775 (cyan). Red dashed lines indicate H-bonds and yellow dashed lines indicate π-π interactions. (B) A stick display style representation of AZD1775 (cyan) and key interacting amino acid residues and target residues (grey) for inhibitor design. Red dashed lines indicate H-bonds and yellow dashed lines indicate π-π interactions. (C) Ligand interaction diagram of the predicted binding mode of AZD1775 in the ATP-binding site of WEE1. Red residues are charged negative, purple residues are charged positive, green residues are hydrophobic, and blue residues are polar, purple arrows indicate H-bonds, green lines indicate π-π interactions, and grey circles indicate areas of solvent exposure. (D) The chemical structure of the WEE1 inhibitors AZD1775 and CM-061 (1).

