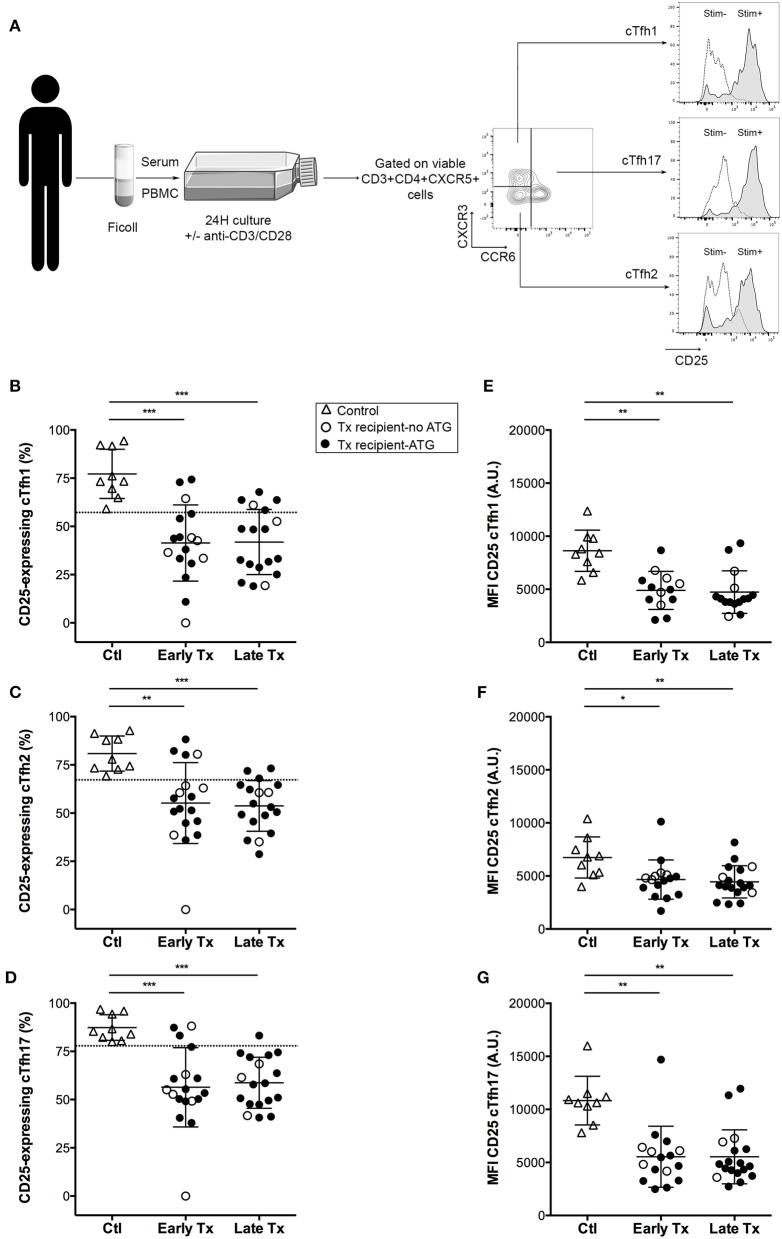
Figure 3.
Comparison of the activation profile of cTfh of controls and transplants patients. (A) Graphical summary of the procedure used to evaluate the residual activatability of the three subsets of cTfh. PBMC of patients were collected just before vaccination. The level of expression of CD25 was measured by flow cytometry on the surface cTfh, after 24 h culture in patient's own serum with (gray profiles, Stim+) or without (open profiles, Stim–) stimulation with anti-CD3/CD28 microbeads. (B–D) The percentage of CD25-expressing cTfh of each of the three subsets (B: cTfh1; C: Tfh2; D: cTfh17) was enumerated by flow cytometry after 24 h of in vitro stimulation in healthy volunteers (n = 9; controls, Ctl; open triangles), and transplant patients (n = 36, circles). The nature of induction immunosuppressive therapy received by transplant patient is indicated. Transplant patients were distributed into two groups according to the time elapsed since transplantation: (i) 6–12 months: early post-transplantation (Early Tx; n = 18), and (ii) >12–72 months: late post-transplantation (Late Tx; n = 18). Dotted line indicates the lower threshold of the percentage of cTfh expressing CD25 after stimulation in control patients. (E–G) The level of expression of CD25 (as reflected by mean fluorescence intensity, MFI) was measured by flow cytometry after 24 h of in vitro stimulation for each of the three subsets of cTfh (E: cTfh1; F: Tfh2; G: cTfh17) and compared between the three groups. Each symbol represents a patient, mean ± SD is indicated. *p < 0.05; **p < 0.01; ***p < 0.001; ****p < 0.0001; ANOVA, Dunn's multiple comparisons test.

