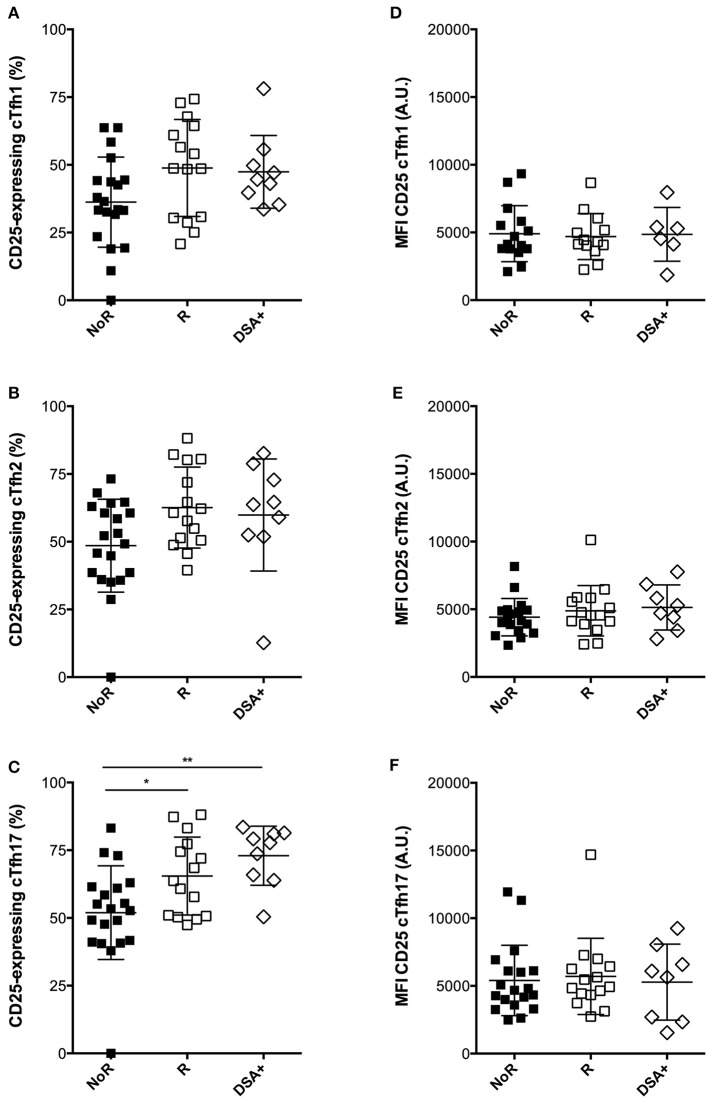
Figure 7.
Comparison of the dynamic profile of cTfh of responders and non-responders to A/Switzerland hemagglutinin. (A–C) PBMC of transplant patients were collected just before vaccination. The percentage of CD25-expressing cTfh of each of the three subsets (A: cTfh1; B: Tfh2; C: cTfh17) was enumerated by flow cytometry after 24 h of in vitro stimulation. Data from transplant patients that had developed (Responders, R; n = 15; open square) or not developed (non-responders, NoR; n = 20; black square) antibodies against Switzerland hemagglutinin are compared between themselves and with that of a cohort of nine transplant recipients that had just developed DSA (group DSA+). (D–F) The level of expression of CD25 (as reflected by mean fluorescence intensity, MFI) was measured by flow cytometry after 24 h of in vitro stimulation for each of the three subsets of cTfh (D: cTfh1; E: Tfh2; F: cTfh17) and compared between the three groups. Each symbol represents a patient, mean ± SD is indicated. *p < 0.05; **p < 0.01; ANOVA, Dunn's multiple comparisons test.

