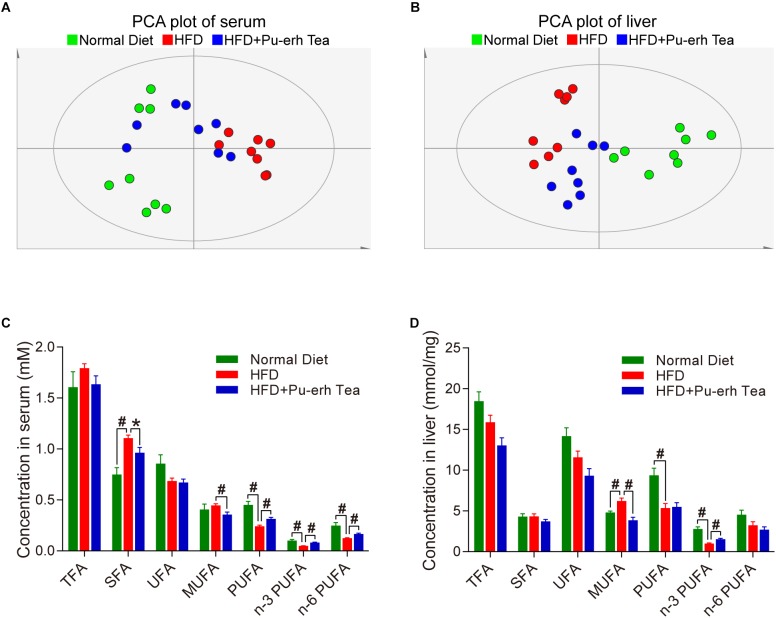
FIGURE 2.
HFD and Pu-erh tea altered FFA profiles and main FFA species in both serum and liver of mice. (A) Principle component analysis (PCA) plot based on serum FFA profile of mice fed with control diet, HFD, and HFD with 450 mg/Kg/day Pu-erh tea for 22 weeks. (B) PCA plot based on hepatic FFA profile of mice fed with control diet, HFD, and HFD with 450 mg/Kg/day Pu-erh tea for 22 weeks. (C) FFA species in serum of mice fed with control diet, HFD, and HFD with 450 mg/Kg/day Pu-erh tea for 22 weeks. (D) FFA species in liver of mice fed with control diet, HFD, and HFD with 450 mg/Kg/day Pu-erh tea for 22 weeks. Data were expressed as mean ± SEM and differences were assessed by Mann–Whitney U test, ∗p < 0.05, #p < 0.005.

