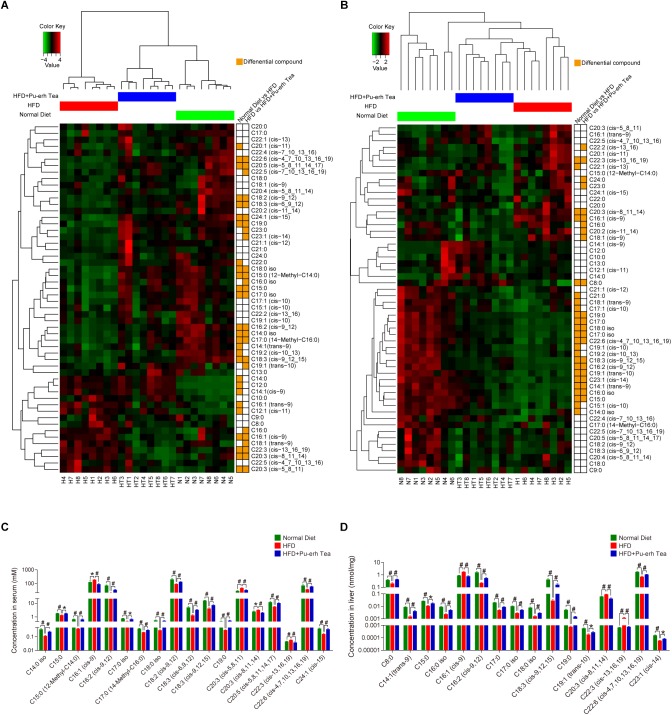
FIGURE 3.
FFA profile and differential FFAs induced by HFD and Pu-erh tea treatment. (A) Heatmap based on Z-scores of serum FFAs in mice fed with control diet, HFD, and HFD with 450 mg/Kg/day Pu-erh tea for 22 weeks. (B) Heatmap based on Z-scores of hepatic FFA profile of mice fed with control diet, HFD, and HFD with 450 mg/Kg/day Pu-erh tea for 22 weeks. (C) Concentrations of differential FFAs in serum of mice fed with control diet, HFD, and HFD with 450 mg/Kg/day Pu-erh tea for 22 weeks. (D) Concentrations of differential FFA in liver of mice fed with control diet, HFD, and HFD with 450 mg/Kg/day Pu-erh tea for 22 weeks. Data were expressed as mean ± SEM and differences were assessed by Mann–Whitney U test, ∗p < 0.05, #p < 0.005.

