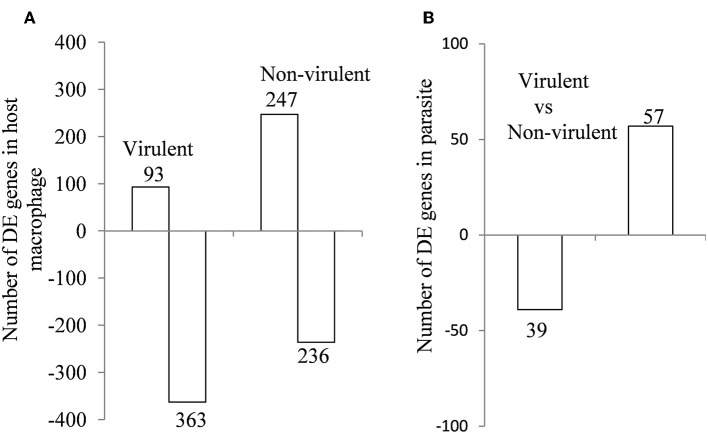
Figure 2.
Differentially expressed genes in (A) murine macrophage infected with virulent and non-virulent L. donovani for 12 h and in (B) L. donovani parasites. The numbers of DE genes in L. donovani-infected macrophages relative to uninfected controls and L. donovani depicted as horizontal bar plots. Box length depicts the number of DE genes either downregulated or upregulated at a P-value of < 0.05 with the total number of down- and up-regulated genes shown.

