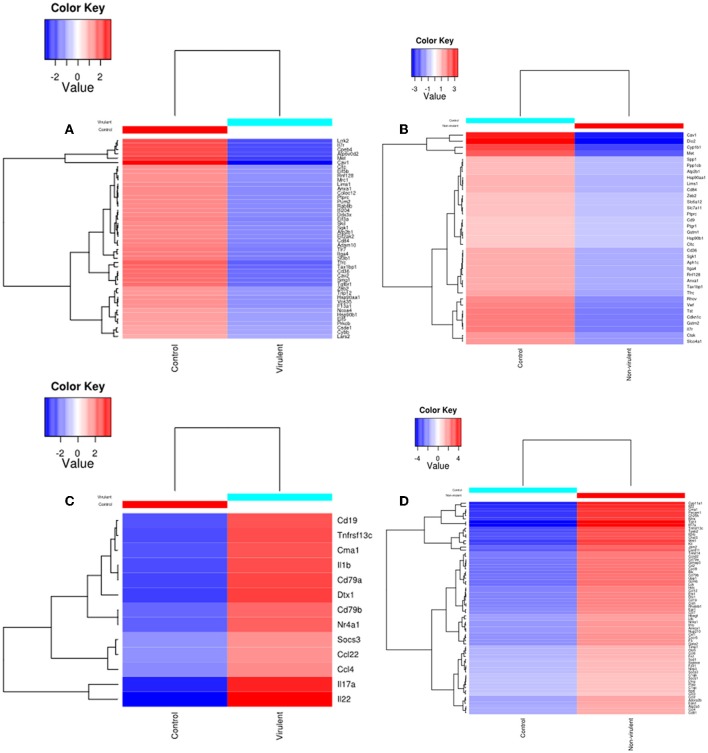
Figure 5.
Heat Map of DE genes in infected macrophage compared to control macrophage. The DE genes involved in KEGG pathways downregulated by (A) virulent and (B) non-virulent parasites are represented as heat maps. Similarly, the DE genes involved in KEGG pathways upregulated by (C) virulent and (D) Non-virulent parasites are represented.

