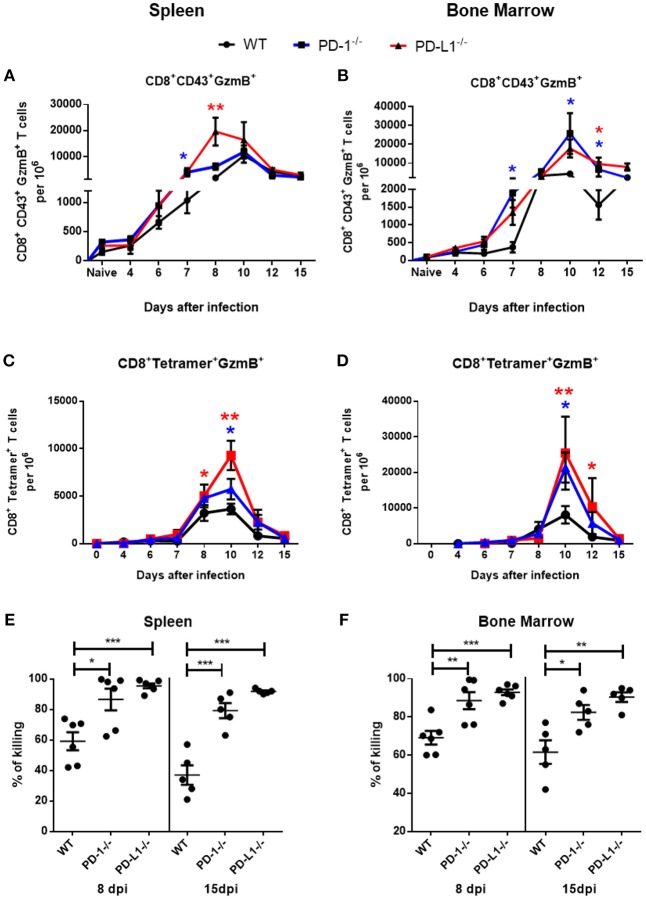
Figure 2.
Cytotoxic CD8+ T cell responses in mice without PD-1 signaling. C57BL/6, PD-1−/− and PD-L1−/− mice were infected with FV and splenocytes and bone marrow were isolated at different time points after infection. Flow cytometry was used to detect intracellular granzyme B in effector CD8+ T cells (CD43+) and in CD8+ T cells specific for the FV gagL epitope (Tetramer+). A kinetic analysis was performed at different time points after FV infection. Shown are the numbers of effector CD8+ T cells expressing B (GzmB) from spleen (A) and bone marrow (B) and the numbers of virus-specific CD8+ tetramer+ CD8+ T cells expressing granzyme B in spleen (C) and bone marrow (D). Each dot represents the mean number plus SEM per one million nucleated cells for a group of 5–9 mice. Data were pooled from three independent experiments with similar results. One-way ANOVA with a Tukey post-test was used for the comparison of both KO mice strains with WT animals at every analyzed time point. Statistically significant differences between the groups (blue for comparison with PD-1−/− and red for comparison with PD-L1−/−) are indicated (*p < 0.05, **p < 0.005). CFSE labeled spleen cells from naïve CD45.1 mice were loaded with FV peptide and were injected intravenously into naïve and 8 or 15 days infected mice. As controls similar number of CD45.1 spleen cells from naïve mice without peptide were co-injected into the same recipient mice. The spleen and bone marrow cells from recipient mice were isolated 2 h after injection and analyzed for numbers of CD45.1+ and CFSE fluorescence. The figure shows the percentage of eliminated FV peptide-loaded donor cells in spleen (E) and bone marrow (F). Each dot represents an individual mouse and the mean numbers and SD are indicated. Differences were analyzed by one-way ANOVA with a Tukey post-test. Statistically significant differences between the groups are indicated (*p < 0.05, **p < 0.005, ***p < 0.0005).

