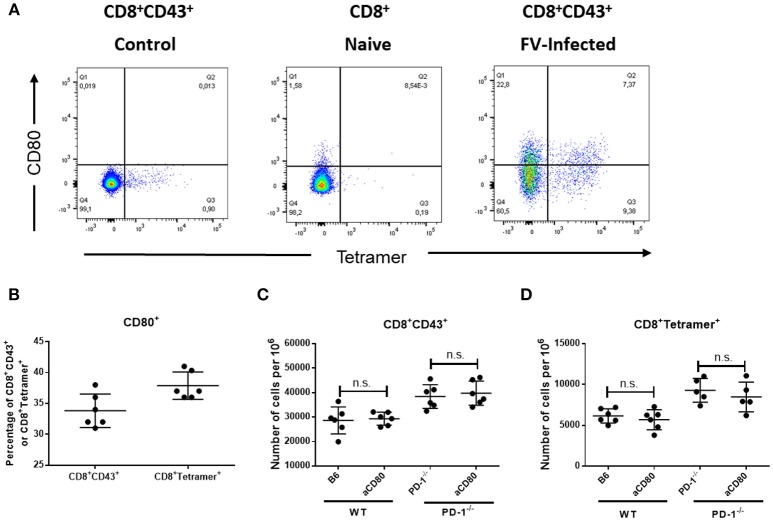
Figure 6.
Expression of CD80 on virus-specific CD8+ T cells and treatment with anti-CD80 antibody. C57BL/6 mice were infected with FV and splenocytes were isolated at day 10 after infection. Flow cytometry was used for phenotypic characterization of effector CD8+ T cells and virus-specific Tetramer+ CD8+ T cells. (A). A representative dot plot of CD8+ T cells from naïve mice (left) or effector CD8+ CD43+ T cells from infected mice (right) show the staining with Tetramers and CD80. (B). Percentage of effector CD8+ T cells and virus-specific CD8+ T cells expressing CD80. (C,D). C57BL/6 and PD-1−/− mice mice were infected with FV and treated with anti-CD80 antibody. Flow cytometry was used to detect the frequency of effector CD8+ T cells and CD8+ T cells specific for the FV gagL epitope (Tetramer+) in anti-CD80 treated and non-treated animals. Each dot represents an individual mouse and the mean numbers and SD are indicated. Two independent experiments with similar results were performed. Differences were analyzed by unpaired t-test.

