Figure 6.
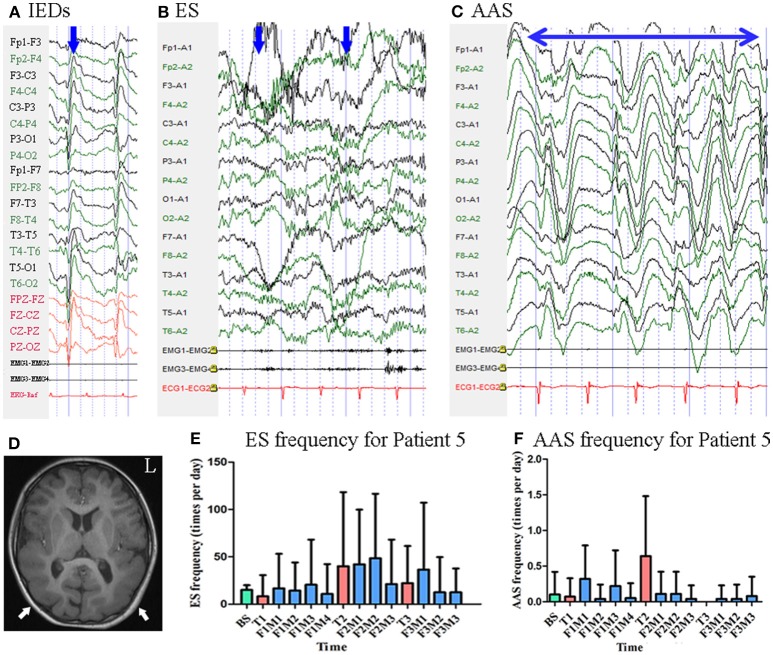
The EEG, MRI and seizure frequency for Patient 5. (A) Interictal EEG for Patient 5 showed IEDs on bilateral central-parietal-posterior temporal regions (blue arrow). (B) Ictal ES EEG for Patient 5 showed typical ictal EEG pattern of ES (blue arrow indicated two ictal ES episodes). (C) Ictal atypical absence seizure EEG for Patient 5 showed synchronous high amplitude 1.5 Hz sharp and wave complexes (the double sided blue arrow indicated the time course of sharp and wave complex rhythm). (D) MRI (T1) scan showed pachygyria in the cortex (white arrow). (E) Seizure frequency of ES for Patient 5. (F) Seizure frequency of AAS for Patient 5. AAS, atypical absence seizure; BS, baseline; ES, epileptic spasm; F1M1-F1M4, the first to the fourth month of the first follow-up; F2M1-F2M3, the first to the third month of the second follow-up; F3M1-F3M3, the first to the third month of the third follow-up; IEDs, interictal discharges; L, left; T1, treatment 1; T2, treatment 2; T3, treatment 3.

