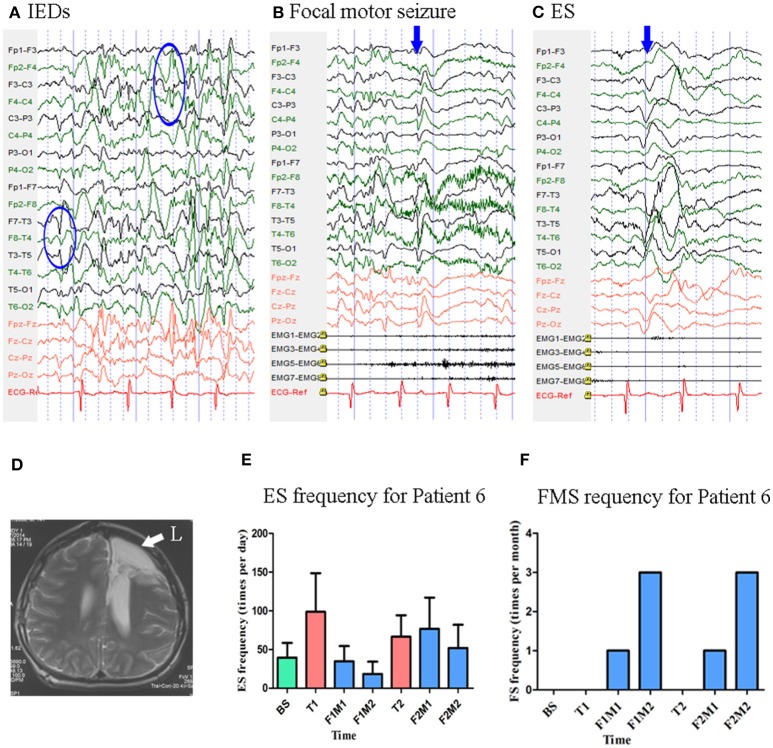
Figure 7.
The EEG, MRI and seizure frequency for Patient 6. (A) Interictal EEG for Patient 6 showed IEDs on right frontal and left temporal electrodes (blue circles). (B) Ictal focal motor seizure EEG for Patient 6 showed low amplitude of fast rhythm on the right frontal-temporal electrodes, the blue arrow indicated the onset of symptoms. (C) Ictal ES EEG for Patient 6 showed typical ictal EEG pattern of ES (blue arrow indicated the high amplitude slow wave). (D) MRI (T2) showed post-operative change in left frontal lobe (white arrow). (E) Seizure frequency of ES for Patient 6. (F) Seizure frequency of FS for Patient 6. BS, baseline; ES, epileptic spasm; F1M1-F1M2, the first to the second month of the first follow-up; F2M1-F2M2, the first to the second month of the second follow-up; FMS, focal motor seizure; IEDs, interictal discharges; L, left; T1, treatment 1; T2, treatment 2.

