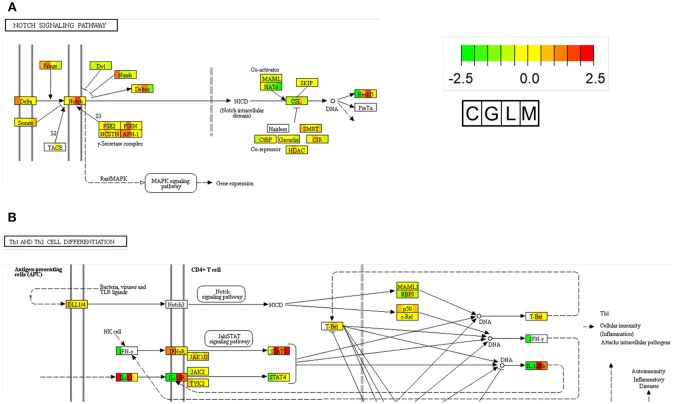
Figure 2.
Pathway map of Notch signaling (A) and Th1 differentiation (B) in KEGG. In each gene boxes, the gene expression levels are shown in 4 fish (C, Carp; G, Grouper; L, Largemouth bass; M, Mullet) spleen 1 day after infection with A. sobria, V. harveyi, N. seriolae, and L. garvieae, respectively, when compared to the control group. The lower expression levels of genes are shown in green, and the higher expression levels of genes are shown in red. Undetected genes are shown by white coloring (see color legend in figure).

