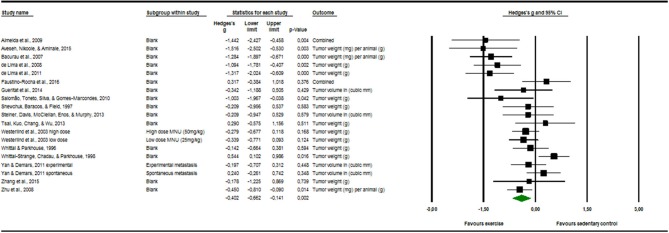
Figure 4.
Meta-analysis of tumor software output presenting Hedges's g, 95% CI (confidence interval) and p-value of the random effect model of tumor size. The size of the squares and the thickness of the horizontal lines express the weight of the presented study. The total Hedges' g effect size is presented as green diamond. Its width expresses the CI. The vertical line at zero represents no difference in adjusted effect size of exercise on tumor growth. Data on the left from the line stands for a decrease and data on the right stands for an increase of tumor size. The heterogeneity was calculated and was shown to be at the end range of moderate [I2 = 70.28%; Q = 60.57; df(Q) = 18; p < 0.00].

