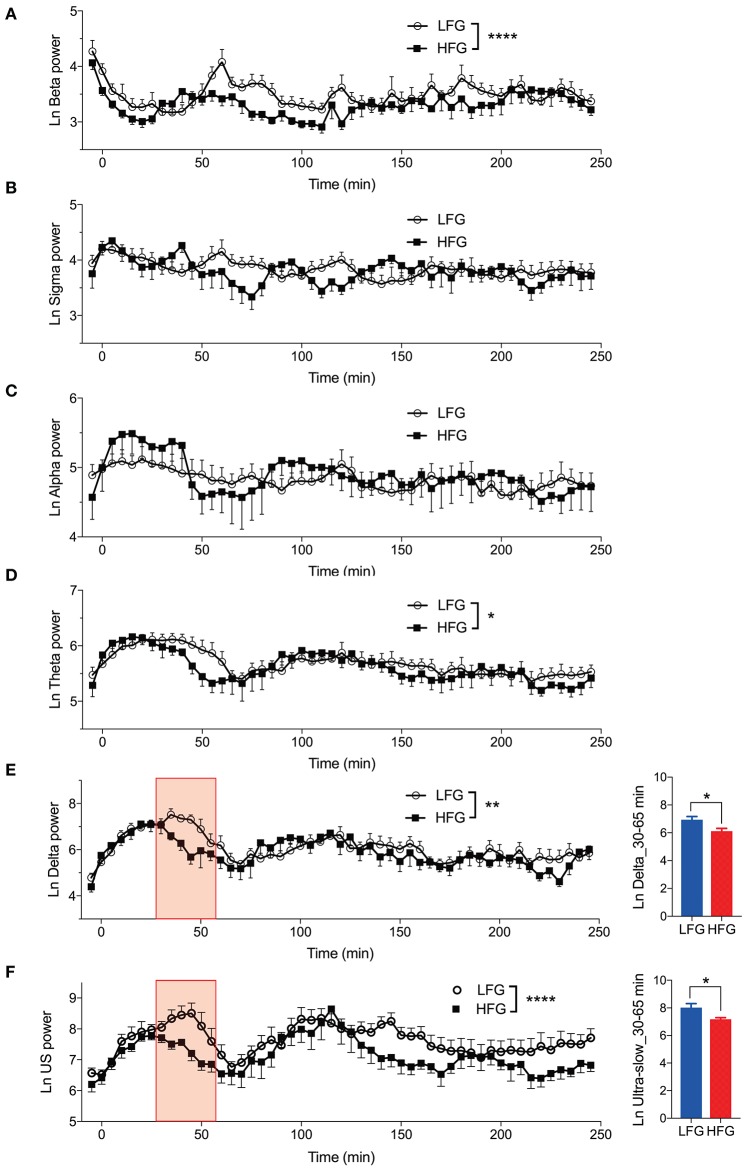
Figure 3.
Changes in the electroencephalography powers during sleep. (A) Changes in the natural-log transformed beta power (Ln Beta). (B) Changes in the natural-log transformed sigma power (Ln Sigma). (C) Changes in the natural-log transformed alpha power (Ln Alpha). (D) Changes in the natural-log transformed theta power (Ln Theta). (E) Changes in the natural-log transformed delta power (Ln Delta). The inset indicates the difference in the mean natural-log transformed delta power from 30 to 65 min (red-colored shaded area) after sleep onset (Ln Delta_30–65 min) between the high fatigue group (HFG) and the low fatigue group (LFG). (F) Changes in the natural-log transformed ultra-slow power (Ln US). The inset indicates the difference in the mean natural-log transformed ultra-slow power from 30 to 65 min (red-colored shaded area) after sleep onset (Ln US_30–65 min) between the HFG and LFG. *p < 0.05, **p < 0.01, ****p < 0.0001, respectively.

