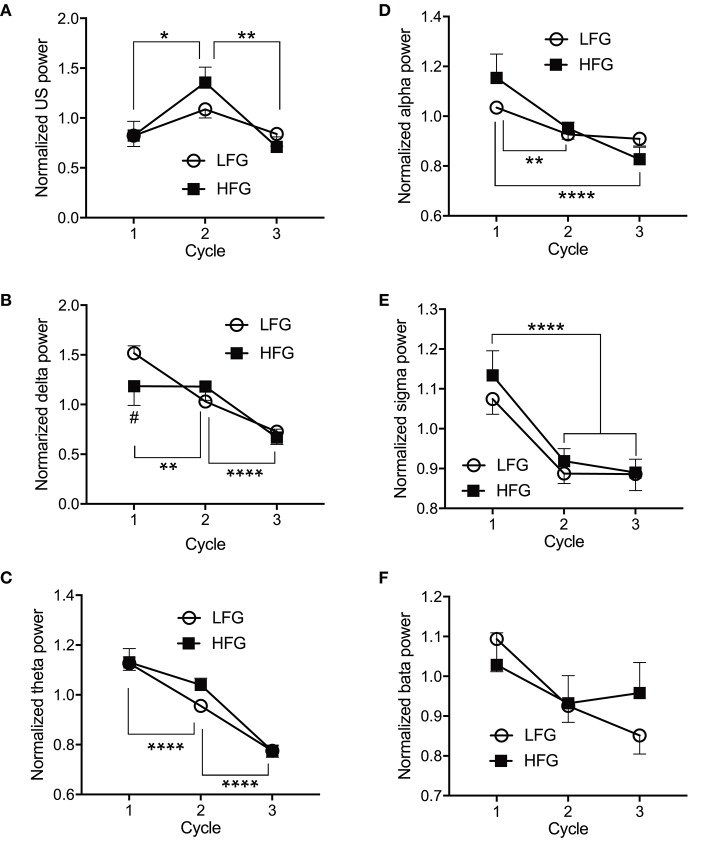
Figure 4.
Comparison of the normalized electroencephalography powers across the three initial sleep cycles. (A) The normalized ultra-slow (US) power. (B) The normalized delta power. (C) The normalized theta power. (D) The normalized alpha power. (E) The normalized sigma power. (F) The normalized beta power. LFG, low fatigue group; HFG, high fatigue group; cycle, sleep cycle. *p < 0.05, **p < 0.01, ****p < 0.0001, respectively. #Significant difference from the LFG (p < 0.05).

