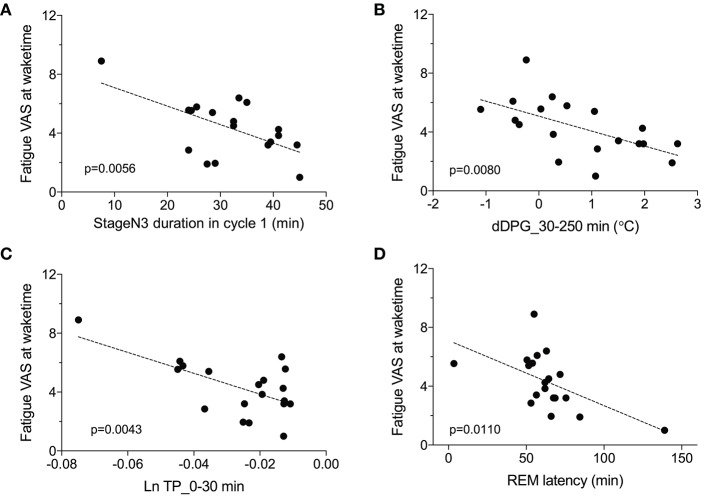
Figure 7.
Parameters correlated with fatigue as determined by the visual analog scale at wake time (Fatigue VAS at waketime). (A) Correlation with the stageN3 duration in sleep cycle 1 (stageN3 duration in cycle 1). (B) Correlation with the mean difference distal-proximal gradient (dDPG) from 30 to 250 min after sleep onset (dDPG_30–250 min). (C) Correlation with the mean natural-log transformed total power from 0 to 30 min after sleep onset (Ln TP_0–30 min). (D) Correlation with the rapid eye movement (REM) latency.

