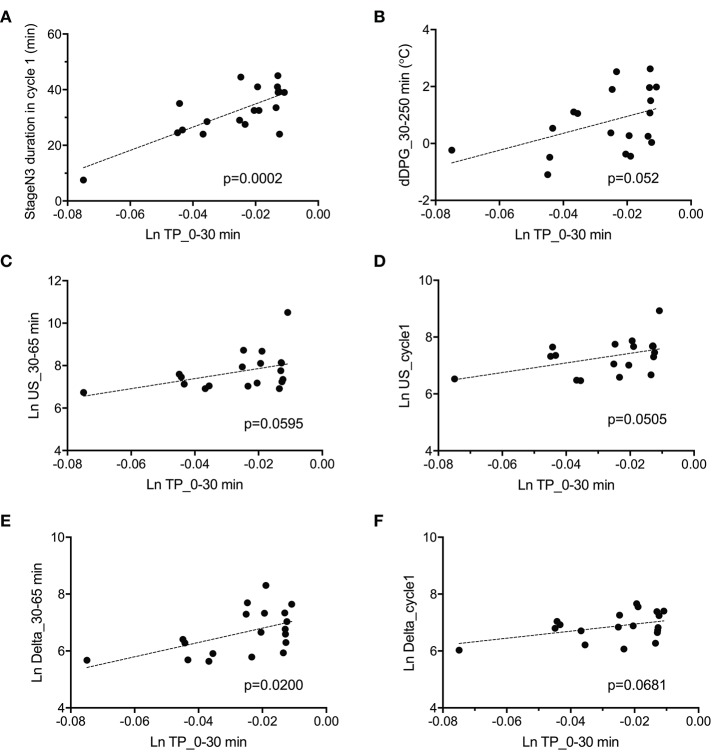
Figure 8.
Parameters correlated with total power during the initial phase of sleep (Ln TP_0–30 min). (A) Correlation with the stageN3 duration in sleep cycle 1 (stageN3 duration in cycle 1). (B) Correlation with the mean difference distal-proximal gradient (dDPG) from 30 to 250 min after sleep onset (dDPG_30–250 min). (C) Correlation with the mean natural-log transformed ultra-slow power (Ln US) from 30 to 65 min after sleep onset (Ln US_30–65 min). (D) Correlation with the mean Ln US in sleep cycle 1 (Ln US_cycle1). (E) Correlation with the mean natural-log transformed delta power (Ln Delta) from 30 to 65 min after sleep onset (Ln Delta_30–65 min). (F) Correlation with the mean Ln Delta in sleep cycle 1 (Ln Delta_cycle1).

