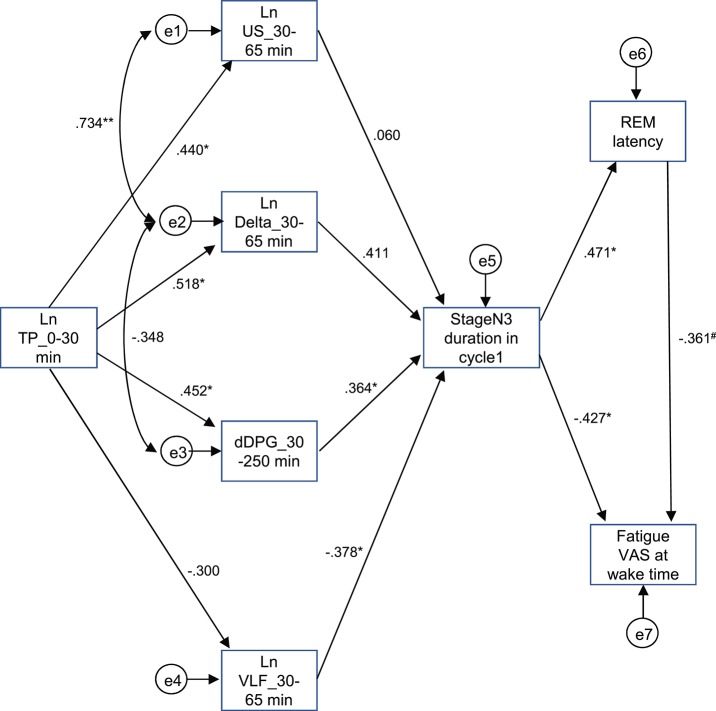
Figure 9.
Diagram and results derived from structural equation modeling with eight observed variables. Single-headed arrows (paths) indicate the causal relationships in the model, with the variable at the tail of the arrow causing the variable at the point. Double-headed arrows indicate covariances or correlations, without a causal interpretation. Statistically, the single-headed arrows (paths) represent regression coefficients, while the double-headed arrows represent covariances. e1-8, measurement errors. Values near the arrows indicate standardized regression coefficients. *p < 0.05, **p < 0.01, #p < 0.1.

