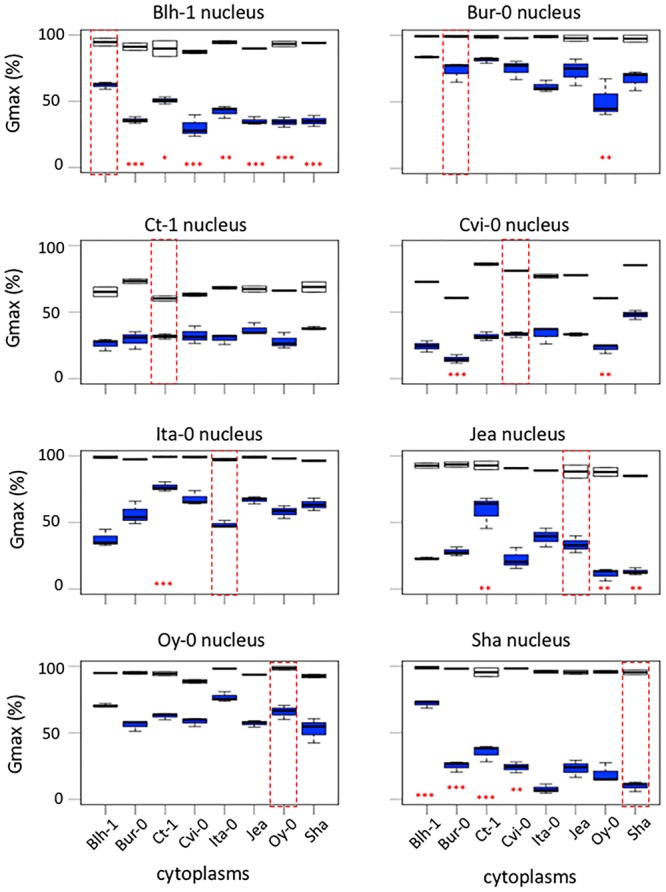
Figure 2.

Germination performance of cytoline series. Each panel shows boxplots of the maximum germination percentage (Gmax) of a nuclear series of cytolines, highlighting the natural parental accession in a red dotted frame. White, germination on water; blue, germination on NaCl. Significant differences of germination performance, averaged on the presence of salt, of cytolines compared to their nuclear natural parent are indicated with red stars. P-value: ∗∗∗<0.001, ∗∗<0.01, ∗<0.05 (see Supplementary Methods S1 for details).
