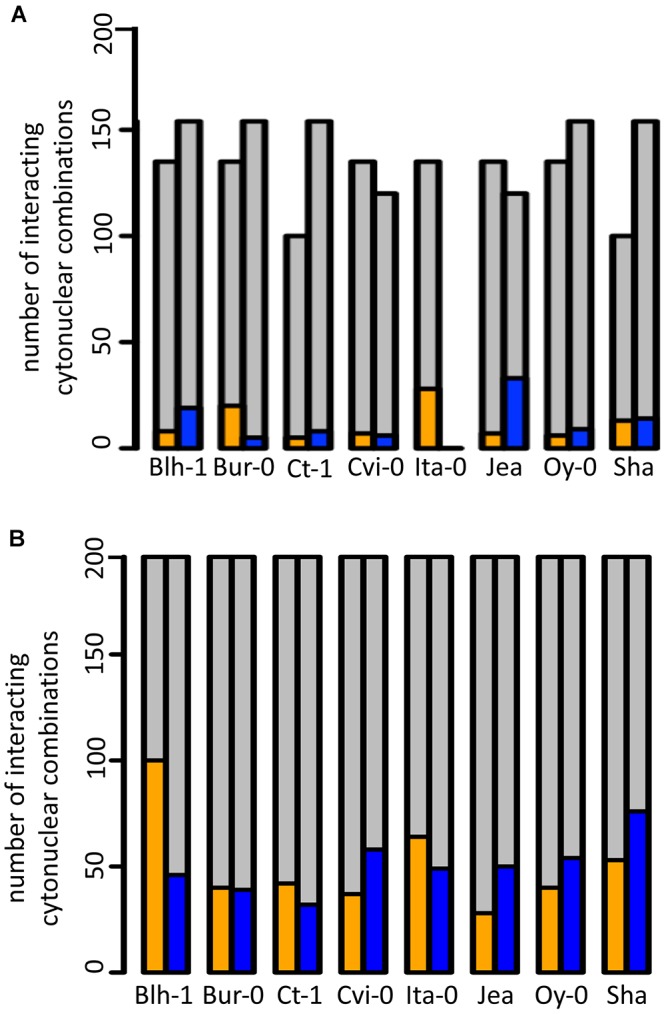
Figure 3.

Contribution of individual accessions to cytonuclear interacting combinations impacting germination traits. Cytonuclear interacting combinations are plotted according to the contribution of individual accessions. For each accession, the number of combinations involving its cytoplasm (orange) or its nucleus (blue) that significantly impacted dormancy depth at the four PH times (A) or germination performance after storage (B) are indicated upon the total number of tested cytonuclear interacting combinations (gray).
