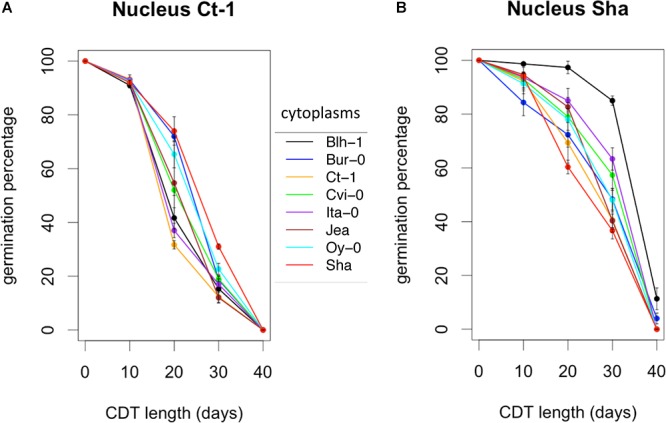
Figure 4.

Kinetics of loss of germination efficiency during artificial aging. Controlled deterioration treatment (35°C, 75% RH) was applied for different durations to seeds from cytolines of the Ct-1 (A) and Sha (B) nuclear series. The means of maximum germination percentage from three replicates were plotted. Vertical bars indicate standard deviations from the mean. The colors of the graphs indicate the cytoplasms of the genotypes: black, Blh-1; blue, Bur-0; orange, Ct-1; green, Cvi-0; purple, Ita-0; brown, Jea; cyan, Oy-0; red, Sha.
