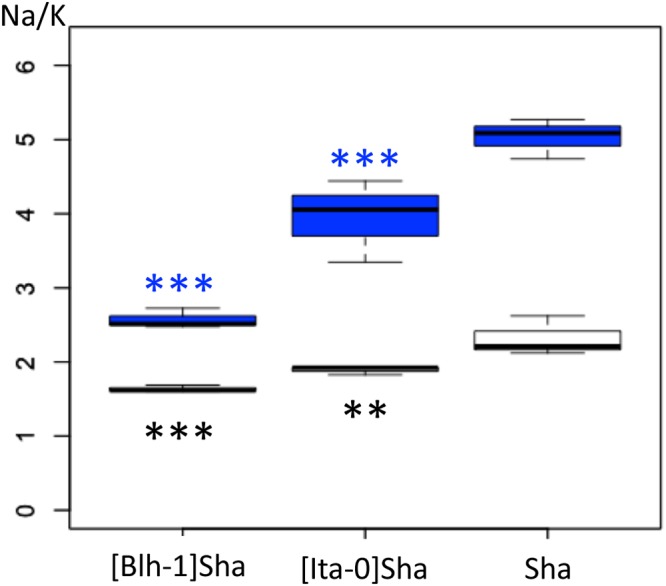
Figure 5.

Ratios of Na+ and K+ ion contents in seeds from lines with different cytoplasms associated with the Sha nucleus. Ratios of Na+ and K+ ion contents just after stratification (white boxplots) or after 20 h of germination (blue boxplots) measured in seeds on 100 mM NaCl. The Na/K ratios were different between the three genotypes in pairwise contrast tests. On the figure, only p-values for comparisons of the cytolines to Sha are shown, ∗∗∗<0.001, ∗∗<0.01.
