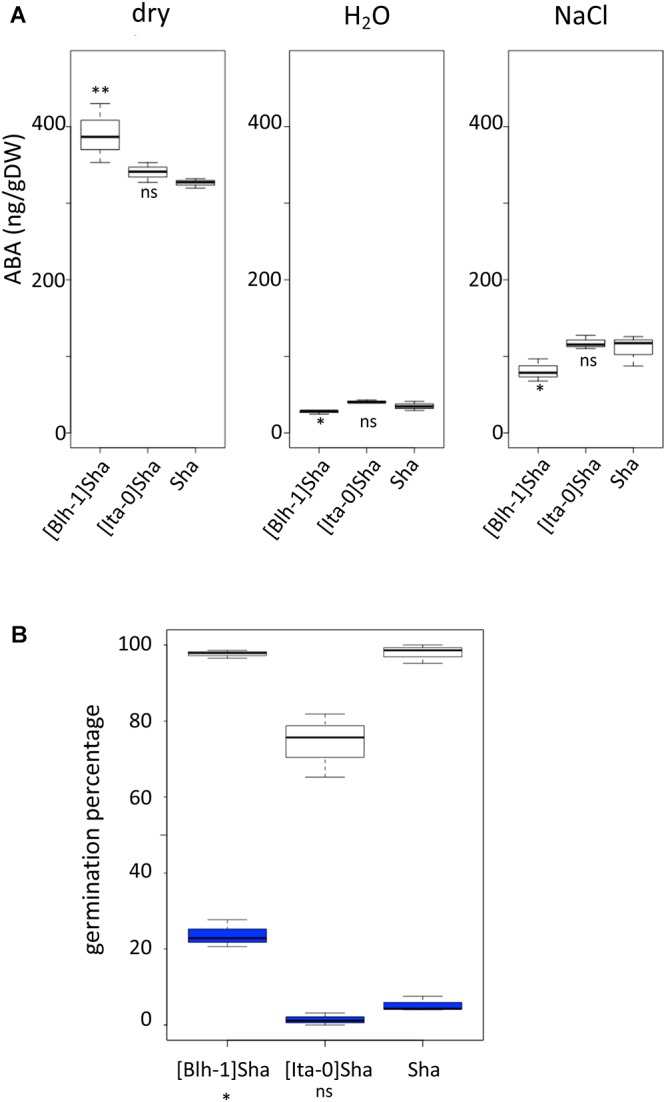
Figure 6.

ABA content and sensitivity in seeds from lines of the Sha nucleus series. (A) ABA content of seeds from [Blh-1]Sha, [Ita-0]Sha and Sha genotypes, at the dry stage (left panel), or after stratification followed by 6 h of germination on water (middle panel) or on salt (right panel). Results of comparisons between the cytolines and Sha in the plotted experiment are shown, ∗∗<0.01, ∗<0.05; ns, not significant. (B) Germination of stratified seeds from [Blh-1]Sha, [Ita-0]Sha and Sha on water (white boxplots) or on 50 μM ABA (blue boxplots). Germination rate was monitored after 4 days. Results of the test for a different germination response to treatment of each cytoline compared to the parent (significant cytoplasm × treatment effect) are indicated; ∗p-value < 0.05; ns, not significant (see Supplementary Methods S1 for details).
