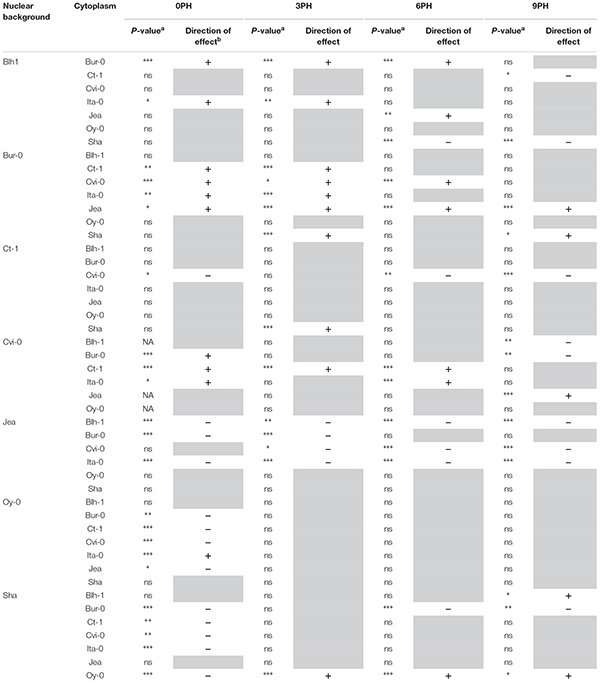
Table 1.
Impact of foreign cytoplasms on germination after various post-harvest times in the different nuclear backgrounds.
 |
For each PH time, a difference in germination success between the genotype and its nuclear parent was tested (see Supplementary Methods S1 for details). For 3PH, 6PH, and 9PH experiments, the cytoplasm effects must be interpreted as averaged on germination temperatures. aP-values: ∗∗∗<0.001, ∗∗<0.01, ∗<0.05; ns, non-significant. bThe direction of the effect is indicated by the sign of the contrast result: (+) indicates that the tested genotype had a higher germination than its natural nuclear donor; (-) indicates the opposite.
