
FIGURE 4.
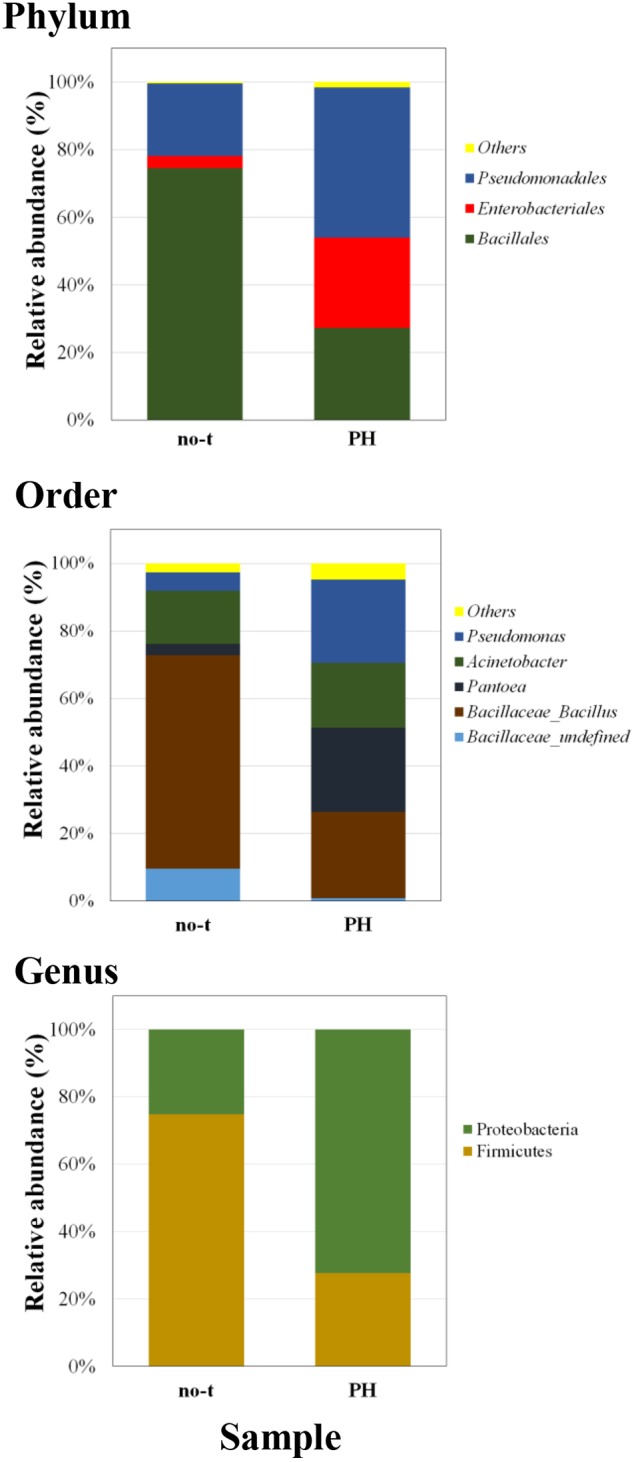
Barplots illustrating the diversity and relative abundances at the phylum, order, and genus levels in PH-treated and no-treated samples collected 1 day after the last treatment. The taxonomy is constructed with the database Silva with a confidence threshold of 97%.