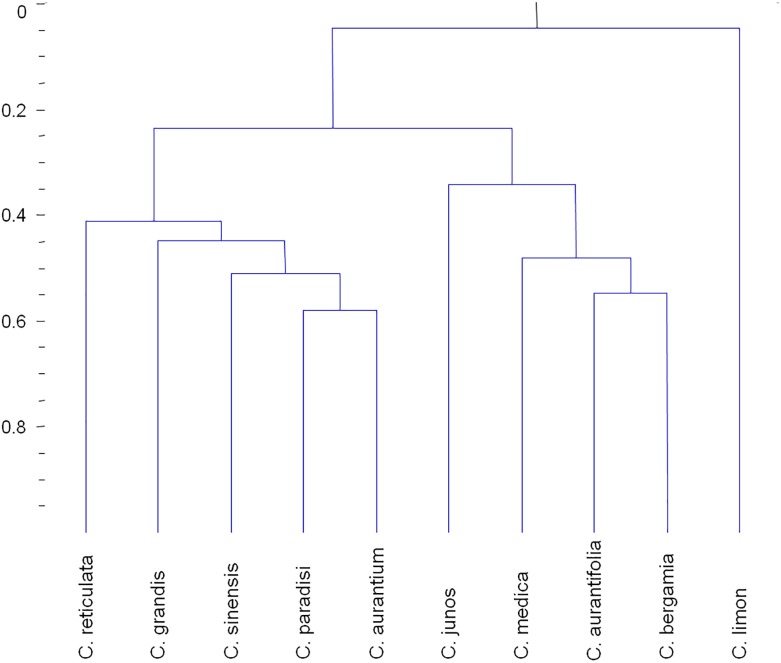
FIGURE 3.
Hierarchical clustering of the 10 most common Citrus species according to their volatile profile as described in the scientific literature. For each species, data were normalized by dividing the number of times a particular compound was reported by the total number of reports of all the compounds in that species. The statistical parameters used were as described in Rambla et al. (2015). The qualitative data used to create HCA is available in Supplementary Table S4.

