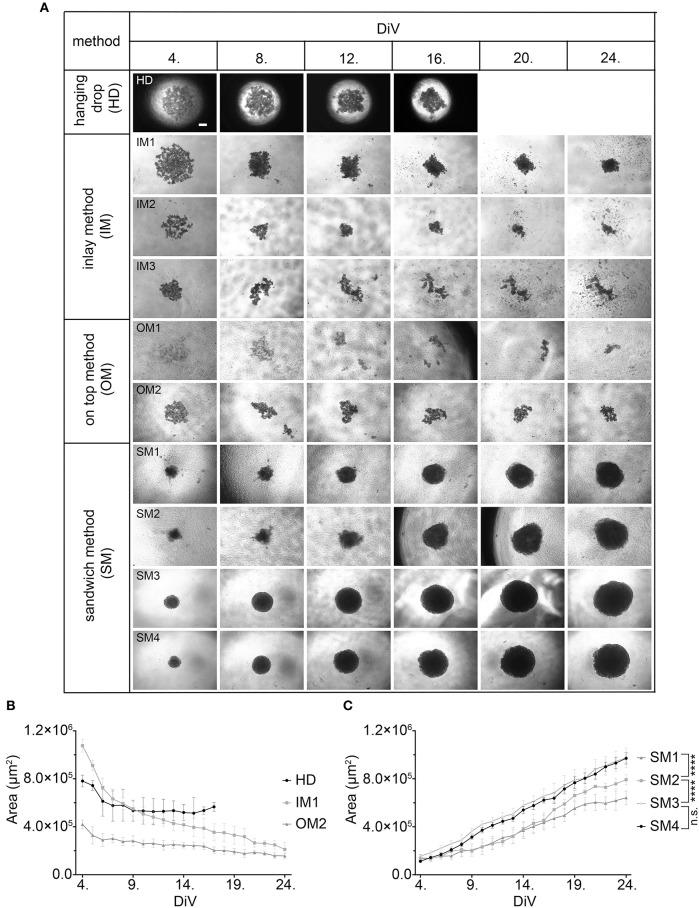
Figure 1.
Sandwich method using SPA and BME yields most consistent growth of MDA-MB-231 spheroids. (A) Representative phase-contrast microscopy images of MDA-MB-231 3D cultures. These were generated using four different methods: hanging drop (HD), inlay method (IM1; IM2; IM3), on top method (OM1; OM2), and sandwich method (SM1; SM2; SM3; SM4). From HD to SM3, equal initial seeding densities were used (10,000 cells/well), for SM4 5,000 cells/well were used. Spheroids were cultured until day 24 in vitro (DiV). Representative images from DiV 4, 8, 12, 16, 20, and 24 are shown. Scale bars, 200 μm. (B,C) Quantitative analysis of 3D culture growth or shrinkage. Graphs depict areas of 3D cultures as a function of DiV (mean values ± SD, n = 4 independent experiments with 5 replicates). Statistical analysis was performed using a two-way ANOVA with post-hoc Tukey's multiple comparison test to compare statistically significant differences across methods for each day. Statistical significance values were observed for 24 DiV: (SM1 vs. SM2, ****P < 0.0001; SM2 vs., SM3 ****P < 0.0001; SM3 vs. SM4, n.s.).

