Figure 3.
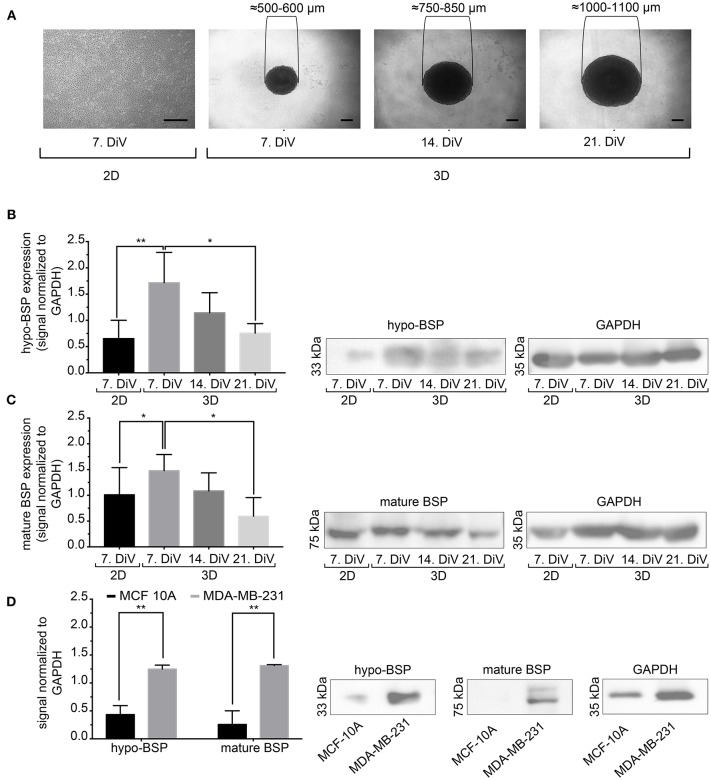
Mature and hypo-BSP protein levels are increased in 3D vs. 2D cultures at 7. DiV. (A) Wide field images of representative 7. DiV monolayer cells and 7.,14., and 21. DiV spheroids as used for biochemical analyses. Scale bars, 200 μm. (B,C) Equal amounts of protein of lysates from monolayer cells (2D) and spheroids (3D) were loaded on SDS-PAGE and Western blots were performed. Left panels depict quantitative analyses of Western blot bands as shown for representative cases in right panels. (B) Results upon incubation with human anti-recombinant human CD-BSP (aa 108–122) showing hypo-BSP expression. Statistical analysis was performed with one-way ANOVA followed by Tukey's multiple comparisons test (n = 6, **P < 0.01, *P < 0.05, mean ± SD). (C) Results upon incubation with rat anti-recombinant human CD-BSP (aa 108–122) TGC-9 indicating expression of mature BSP. Statistical analysis was performed with one-way ANOVA followed by Tukey's multiple comparisons test (n = 6, *P < 0.05, mean ± SD.). (D) Lysates of non-cancerogenous breast cell line MCF 10A were compared to those of MDA-MB-231. Graph shows quantitative analysis of Western blot band intensities as exemplified on the right side. Significant differences between groups were tested using an unpaired, two-tailed t-test (n = 3, **P < 0.01, mean ± SD).

